Are you someone who has to work with a lot of statistical data on Microsoft Excel? Then you must be familiar with the term ‘z-score’. Even if you were not privy to it before, you may have to work with some data and calculate their z-score.
For a huge amount of data, it is not feasible to individually calculate the z-score for each data. This calculation can be done effortlessly in the Microsoft Excel app.
The method and formula of calculating z-score in Excel has been presented here in a step-by-step process. If you have been facing trouble while calculating the z-score for a lot of data, do not worry anymore!
Going through this guide will help you understand and carry-out the process of calculating z-score in Excel very easily.
What Is Z-Score in Statistics?
Z-score is also called Standard Score because it is a standardized measure of distribution of data on your spreadsheet file.
Z-score can be used to:
- Make comparisons between two or more samples of data
- Predict the probability of getting a certain value in the future
The z-score of a data point in your spreadsheet indicates the number of standard deviations it is away from the mean. From this, you can probably figure out that you need to calculate the mean and standard deviation of your data if you want to find out the z-score in Excel.
You can do this z-score calculation with ease in Microsoft Excel by using the formulas to find mean and standard deviation of your data at first.
The formula of calculating z-score is shown and elaborated on the next section.
Related guide: how to Make a Histogram in Excel
What Is The Formula For Calculating Z-Score?
There isn’t a preset formula option in Microsoft Excel that you can use for calculating z-score but there are formulas to find out the mean and standard deviation of your data. The values of mean and standard deviation are necessary in order to calculate z-score.
From the definition of z-score, we can derive that to calculate the z-score of a data point, we have to divide its difference from the mean by the value of standard deviation.
The formula to calculate z-score of your data is a very simple one. It is elaborated here so that you can easily understand and employ it to your needs.
Also, check out our separate post on Microsoft Excel Freezing or Slow.
The z-score formula is:
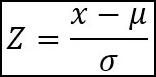
Here, Z = the z-score of a data point in your sheet
x = the value of the data-point
µ = the mean value
σ = standard deviation of your data
So, (x-µ) = the difference of the data point and the mean value
When you divide (x-µ) by σ, you will find out by how many standard deviations is a certain data point away from the mean.
This is all you need to know before you evaluate each data point in your Excel data sheet to know their z-score. Now you can move on to actually finding out the z-score on Microsoft Excel. The process of doing this has been explained step-by-step in simple words so that you can easily grasp it.
You can find this on the next section of the guide so go through it to learn how to calculate z-score in Microsoft Excel.
Here’s a complete guide on how to Highlight Duplicates In Excel.
How To Calculate The Z-Score In Microsoft Excel?
Calculating the z-score of your data in Excel is very simple and it also very efficient. You can find out the z-score of a big number of data in an instant. Firstly, you have to calculate the mean and standard deviation of your data and then use them to assess the z-score of individual data points.
Finding out the z-score in Excel will be a piece of cake for you after you go through the process of doing it that has been discussed here.
Follow these steps to know how to calculate z-score in Excel:
1. Find Out the Mean of Your Data
As you know, in order to calculate the z-score of your data, you first have to determine mean value of your data first. Mean is basically the average value of your data and it can be found in Excel by using the AVERAGE() formula.
Here’s how you can find the mean value of your data in Excel:
- Open your spreadsheet in Microsoft Excel.
- Determine a cell to hold your mean value.
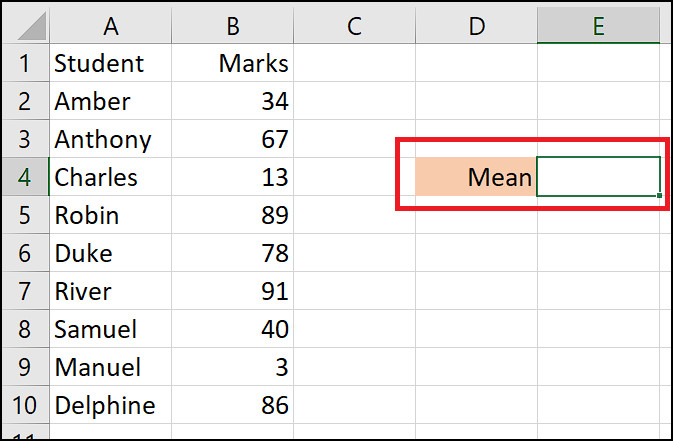
- Type in this formula in the mean cell: =AVERAGE(n1:n2).
Here, n1 = starting cell of your data and n2 = ending cell of your data. For example, according to the image, you need to type in =AVERAGE(B2:B10).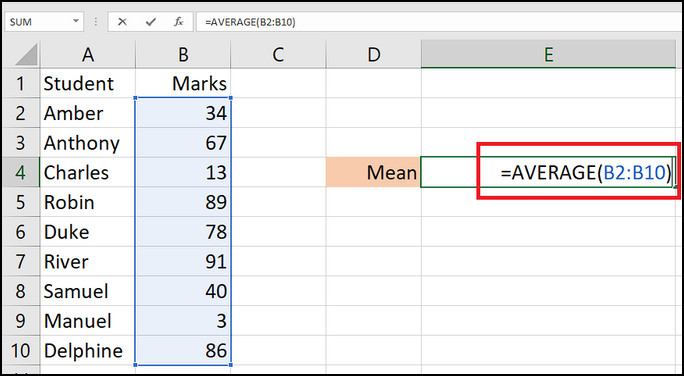
- Press Enter.

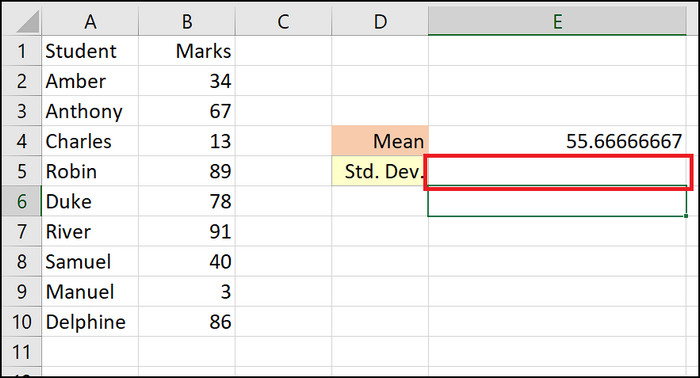
When you take these steps, the mean value of all your data will then appear in the cell that you have chosen and typed the formula in. We will use this mean value later to assess the z-score. Before that, we have to find out the standard deviation of your data which is described on the nest step.
Check our epic guide on how to Freeze Panes In Excel Easily.
2. Calculate the Standard Deviation
The value of standard deviation of your data can also be found using a formula in Excel. The one we will use to find it is STDEV.P(). Standard deviation’s value indicates how dispersed the values in your sheet are from the mean.
This is how you can calculate the standard deviation in Excel:
- Determine a cell for holding the value of standard deviation.
- Type this formula in that cell: =STDEV.P(n3:n4).
Here, n3 = starting cell of your data and n4 = ending cell of your data. For example you need to type in =STDEV.P(B2:B10) according to the cells in this image.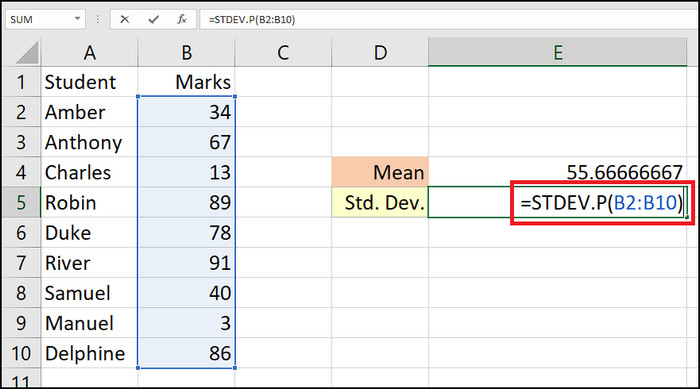
- Press Enter.
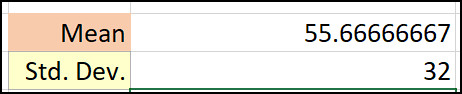
The standard deviation value will then emerge in the cell where you typed in the formula. Now that you have the values of mean and standard deviation, you can start to calculate your z-score.
Quickly visit the links to find out how to freeze a row on Excel easily.
3. Calculate the Z-Score of Every Data Point
You can now start with the process of getting the z-score of your data points with the mean value and standard deviation.
Go through these steps to calculate z-score of your data points:
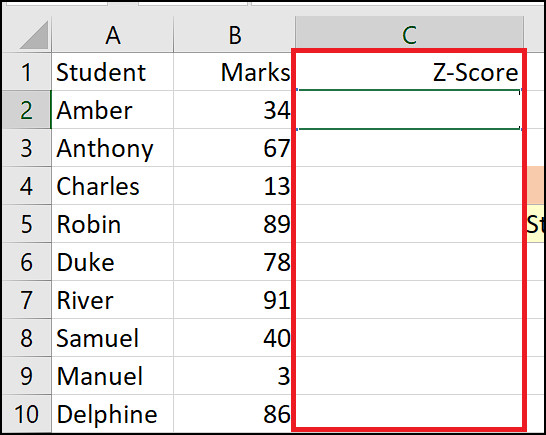
- Make a new column beside your data for holding the z-scores.
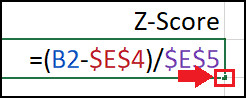
- Type in the z-score formula on the first cell: =(n5-$n$6)/$n$7.
Here, n5 = first cell of your data column, n6 = mean cell and n7 = standard deviation cell. For example you need to type in =(B2-$E$4)/$E$5 according to the cells in this image.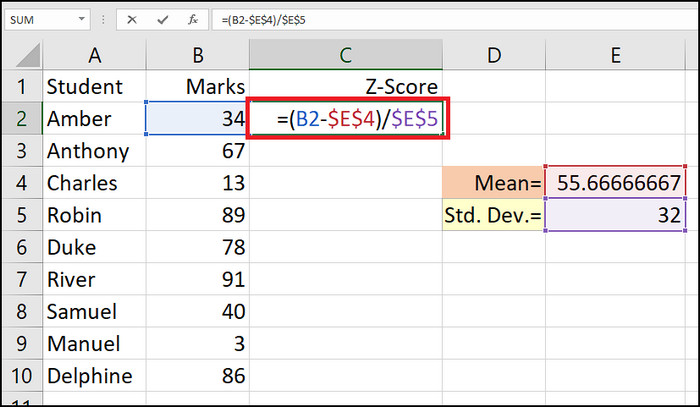
- Click and hold the bottom-right corner of the cell.
- Drag it down to enter the formula in every cell of the column.
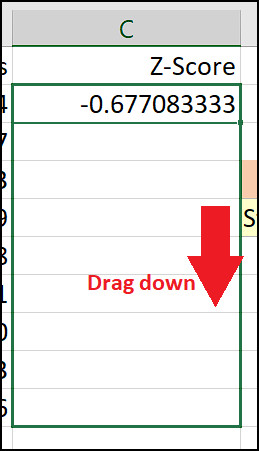
You will now have an entirely new column of cells showing the z-score of respective data points. 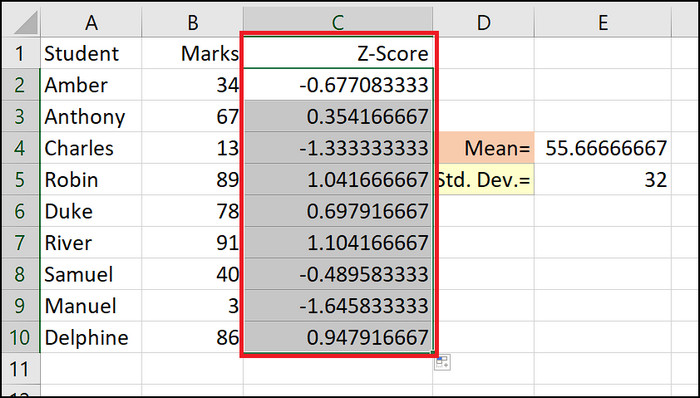
Conclusion
Microsoft Excel can arguable called the ultimate tool for managing statistical data because of all the features within it. Using the formulas in Excel, you can easily calculate the z-score of specific or every data point in your in your Excel spreadsheet. As you have seen in this guide, the process of doing it is very easy.
After having gone through the guide, you should now be able to utilize Excel app in a matter moments to find out your desired z-score.