Excel is widely used for statistical data analysis. Variance is a very useful measure to understand the variability of the data from the mean. When working with statistical data, you will often need to find the variance of the data to present some sort of analysis.
If you are working with Excel and you do not know how to find the variance of the dataset you are working with, then do not worry. As someone who is experienced in Excel and data analysis, I want to assure you that finding variance in Excel is very easy.
In this article, I will talk about variance, the two types of variance we deal with, and how to find the two types of variance in Excel.
So keep reading this article until the end to learn how to find variance in Excel.
What is Variance in MS Excel?
Variance is a measure of dispersion. The deviation from the mean for every piece of data is squared and then added. The sum of the squares can be regarded as a measure of the total dispersion of a distribution. The mathematical formula depends on whether all the observations form a population or not.
To properly understand what variance is, it is better if you first understand what dispersion is. Measures of central tendency such as the arithmetic mean, mode, or median can describe the center of a set of data. But they do not tell you how the data is spread out.
Understanding how data is spread out on either side of the center is crucial when it comes to understanding a set of observations. This characteristic of data is known as dispersion or variation.
Small dispersion indicates high uniformity of the observations in the distribution. No dispersion indicates that all the data are identical. The study of dispersion is important because different distributions can have the same average but plenty of differences in variability.
Some of the measures of dispersion include range, quartile deviation, mean deviation, standard deviation, and variance. Our discussion for this article will be limited to variance.
Finding the mean deviation of each observation is the first step in the mathematical process of calculating variance. Then you square all the mean deviations and sum them. Then you divide the sum with the total number of observations.
So what does variance tell you in Excel? A high variance means the data distribution is quite spread out from the center. A low variance means the data distribution has high uniformity.
I have used the word observation a few times by now. In case you do not know what it means, I should clarify it for you.
An observation is a fact or figure we gather regarding a certain variable. It can be quantified or described as a quality. In Excel, all the data we enter after observing the real world can be called an observation. However, variance can only be found for quantitative variables.
Related guide: how to Make a Histogram in Excel.
What Are the Two Types of Variance in Excel?
The two types of variance we want to learn how to calculate are population variance and sample variance. Sample variance is the variance computed from sample data, whereas population variance is the value of variance obtained from population data.
The entire group about whom you want to make conclusions is referred to as a population. The particular group from whom you will gather data is known as a sample. The sample size is always smaller than the population as a whole.
To calculate the population variance mathematically in Excel, you divide the sum of the squares of the mean deviations for each observation by the total number of observations.
To find the sample variance, you divide the sum of the squares of the mean deviation for each observation by a number that is 1 less than the total number of observations. This is why the sample variance will always be larger than the population variance.
To calculate population variance in Excel, we use the VARP, VAR.P, and VARPA functions.
To calculate sample variance in Excel, we use the VAR, VAR.S, and VARA functions.
VAR.P and VAR.S are only available from Excel 2010 onwards.
Here is a table to summarize the differences between the functions and what arguments they can evaluate:
| Function | Arguments | |||
|---|---|---|---|---|
| Logical arguments (within arrays and references) | Text representations of numbers (within arrays and references) | Logical Values and Texts (directly as arguments) | Empty Cell | |
| VAR | Ignored | Ignored | Evaluated (TRUE=1, FALSE=0) | Ignored |
| VAR.S | Ignored | Ignored | Evaluated (TRUE=1, FALSE=0) | Ignored |
| VARA | Evaluated (TRUE=1, FALSE=0) | Evaluated as Zero. | Evaluated (TRUE=1, FALSE=0) | Ignored |
| VARP | Ignored | Ignored | Evaluated (TRUE=1, FALSE=0) | Ignored |
| VAR.P | Ignored | Ignored | Evaluated (TRUE=1, FALSE=0) | Ignored |
| VARPA | Evaluated (TRUE=1, FALSE=0) | Evaluated as Zero. | Evaluated (TRUE=1, FALSE=0) | Ignored |
I will later show you examples where I apply these functions.
Arguments should be supplied as values, arrays, or cell references. For a sample or population, you can provide up to 255 parameters in Excel 2007 and later; in Excel 2003 and earlier, you can only provide up to 30 arguments.
#VALUE! errors are produced by arguments that have text in them that cannot be translated into numbers.
Also, check out our separate post on Microsoft Excel Freezing or Slow.
How to Find Variance in Excel?
You can use some of the functions mentioned above to find the variance of a set of observations in Microsoft Excel. I will show you 3 examples to get you used to this. I am going to start off by finding the variance between 2 numbers.
Then I’m going to show you how to find the population and sample variance of a set of observations.
Here are the examples:
1. Find the Variance Between Two Numbers in Excel
You can find the variance of two numbers using any of the functions mentioned above. I will show how to find the population and sample variance of two numbers. Let’s say we take two numbers, 10 and 4.
Put them in any two cells. I will put them in cells A1 and A2. To find the sample variance between the two numbers, you can use the VAR and VARP functions that have existed in all versions of Excel since 2000.
I have applied the VAR function in cell A3 and the VARP function in cell A4. The two variances will be found.
The formulas are given below:
| =VAR(A1,A2) |
| =VARP(A1,A2) |
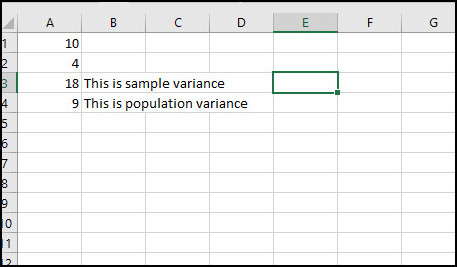
As we can see from the image above, Excel found the sample variance to be 18 thanks to the VAR function. It found the population variance to be 9 thanks to the VARP function.
Let’s manually calculate the 2 variances to check if we are doing things right.
The mean of the two numbers is (4+10)/2, which is equal to 7. The mean deviation for each number is 3 and -3. Squaring both numbers, we get 9. Adding the squares of both numbers, we get 18.
This calculation is the same when finding sample variance and population variance. Now, there are two observations here. So, to find population variance, we will divide 18 by 2, but for sample variance, we will divide the variance by (2-1) = 1.
So, calculating manually, the population variance will be 9 and the same variance will be 18, which is what the Excel functions provide.
Here’s a complete guide on how to Highlight Duplicates In Excel.
2. Find the Sample Variance in Excel
In this example, I will show you how to find the sample variance using all 3 formulas mentioned for finding sample variance. We will test all 3 to show that all of them provide the same result.
We will test the functions on a sheet containing the names and ages of the players in the Arsenal Football Club first team squad. Remember that variance is found in quantitative data. So we can only find the variance for age.
The ages of 23 players are stored in cells from B2 to B24. We apply the following 3 formulas in 3 different cells:
| =VAR(B2:B24) |
| =VAR.S(B2:B24) |
| =VARA(B2:B24) |
I chose F3 to F5 as the 3 cells. You can see the sample variance in those cells after you apply each formula by pressing Enter. 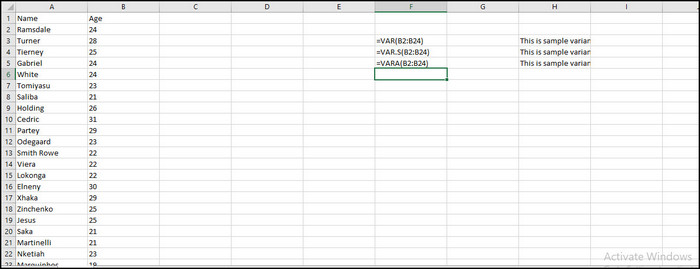
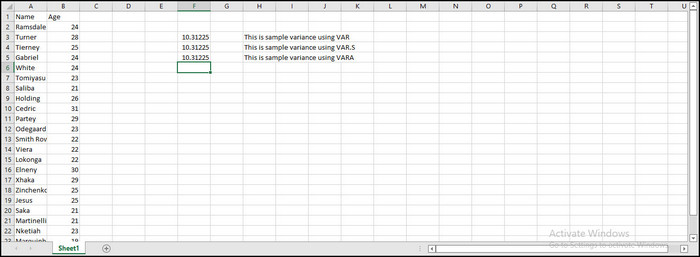
As you can see, all the functions provide the exact same result. This was an example to show that all functions work to find sample variance. You can manually verify the answer yourself.
Check our epic guide on how to Freeze Panes In Excel Easily.
3. Find the Population Variance in Excel
Using the spreadsheet used for the previous example, I can show you that all three functions mentioned for finding the population variance also provide the exact same variance when you enter an array of numerical values or cell references.
We apply the 3 different functions in 3 different cell formulas:
| =VARP(B2:B24) |
| =VAR.P(B2:B24) |
| =VARPA(B2:B24) |
I have applied the three formulas in cells F9, F10, and F11, respectively.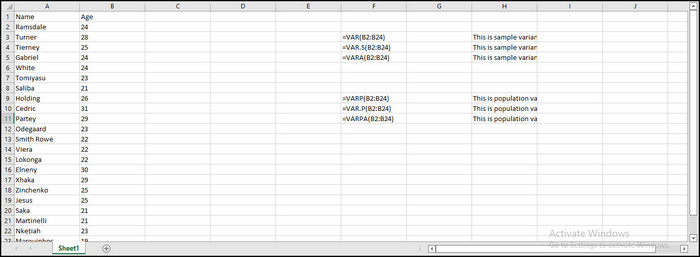
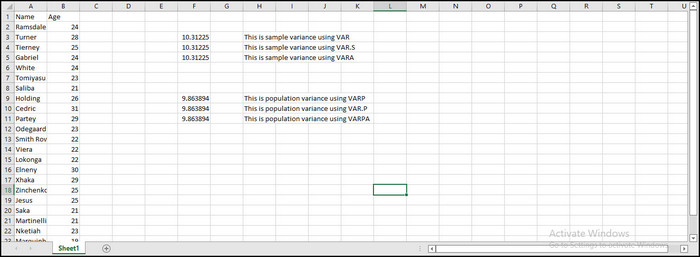
As you can see, all the results are the same. This shows that these Excel functions work if you want to find population variance. You can manually verify the answer yourself.
Quickly visit the links to find out how to freeze a row on Excel easily.
Conclusion
There are different types of functions you can use to find population and sample variance in Excel. The process is very easy and identical for all the functions.
Use the VAR or VAR.S function to determine sample variance and the VARP or VAR.P function to determine population variance when evaluating references that only include numbers and ignore empty cells, text, and logical values.
Use the VARA or VARPA function to evaluate logical and text values in references. In order to avoid a #DIV/0! error, enter at least two numeric values into a sample variance formula and one numeric value into a population variance formula in Excel.
If you have any further queries, please comment below!