Have you ever desired to put two different data series in a single chart? Well, it is possible with the Excel secondary axis option.
When the data varies a lot from series to series, or you want to combine multiple data series in a chart, it’s helpful to use a secondary axis.

The secondary axis allows the user to present and visualize data series from multiple diagrams in a single chart without adding a chart.
However, many people don’t know the procedures to add them makes the datasheet crowded and complex.
In this article, I’ll provide a straightforward way to add a secondary axis in Excel and the methods to modify them.
So, let’s begin.
Check out the easiest way how to make a histogram in Excel?
Download the Worksheet
Consider downloading the worksheet below to see the steps covered in this article and practice them.
How to Add a Secondary Axis in Excel
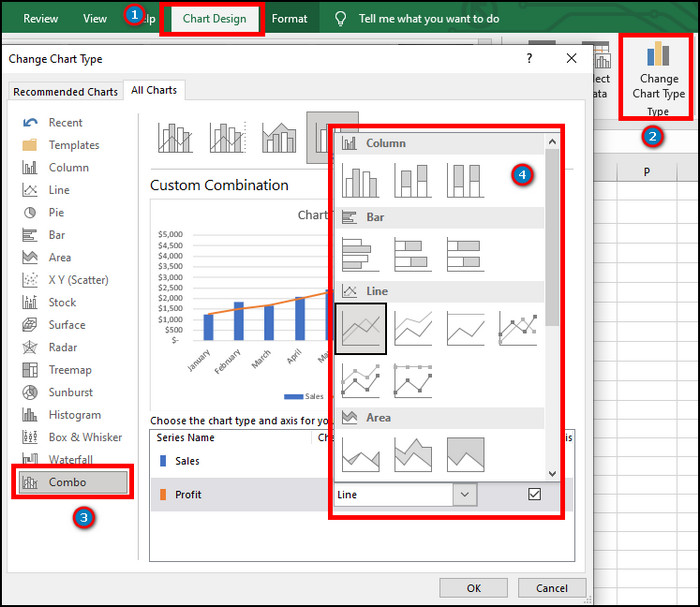
By checking the Secondary Axis Box from the Combo section, you can add a secondary axis to your Excel chart. Adding it in Windows is effortless, and you can add it in a short time by following the steps carefully below.
Here are the steps to add a secondary axis in Microsoft Excel:
- Launch the Microsoft Excel application.
- Open your Excel datasheet.
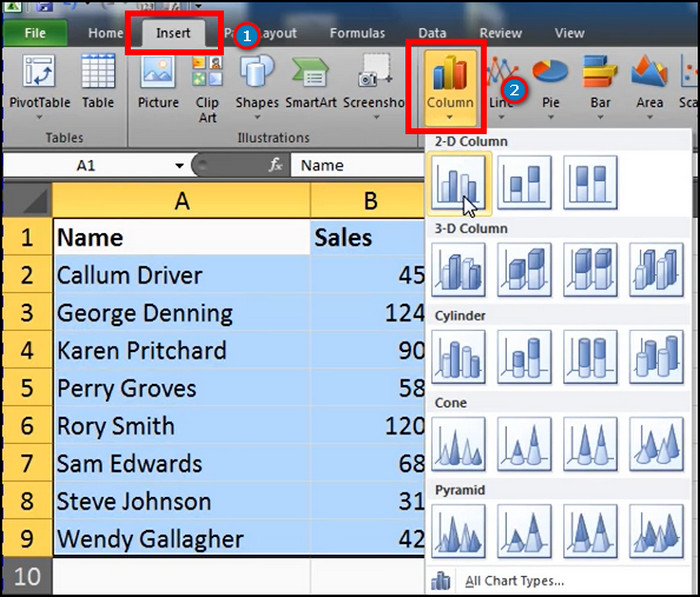
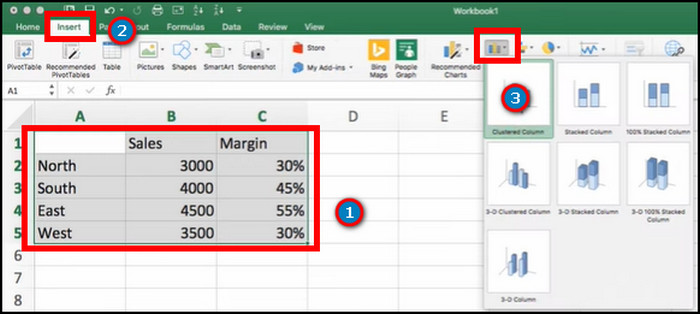
- Select your data range.
- Go to the Insert tab from the ribbon.
- Add a chart.
- Click anywhere on the chart.
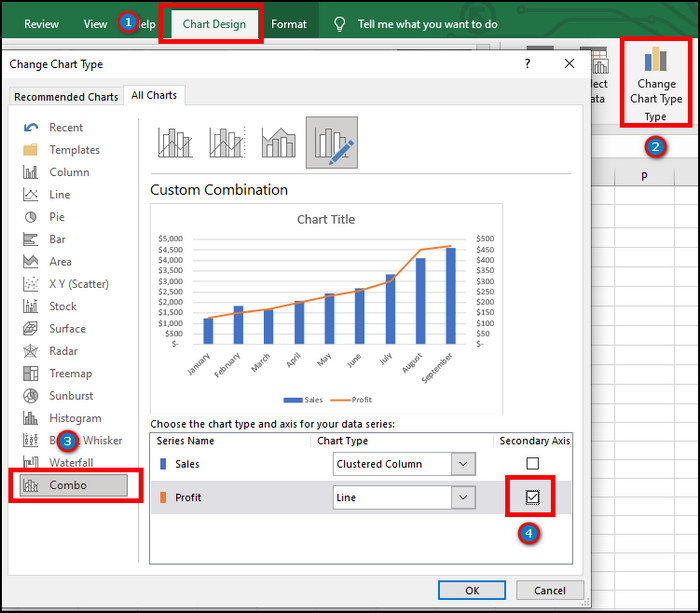
- Navigate to the Chart Design tab from the top ribbon.
- Click on Change Chart Type.
- Press on Combo from the left pane.
- Check the Secondary Axis Box beside the Series Name.
- Click on OK.
Your chosen series will show as a secondary axis on the chart. This procedure is applicable for Microsoft Excel 2013 and above. If you are an MS Excel 2010 user, consider reading the methods below.
Follow our guide on how to lock or unlock cells in Excel.
How to Add Secondary Axis in MS Excel 2010
By choosing the Secondary axis option from Format Data Series, users can add it to their chart on Microsoft Excel 2010. The option in MS Excel 2010 is different from Excel 2013 and later. Consider reading the procedures below to learn about them.
Here are the procedures to add a secondary axis in MS Excel 2010:
- Open MS Excel 2010.
- Go to your datasheet.
- Select the data range.
- Go to Insert.
- Add a Chart.
- Press anywhere on the chart.
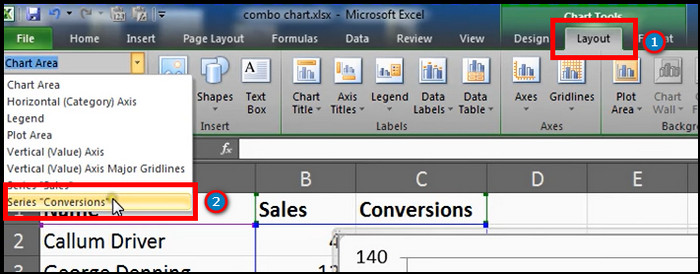
- Navigate to Layout from the top ribbon.
- Click the drop-down menu from the Current Selection.
- Press on your preferred series.
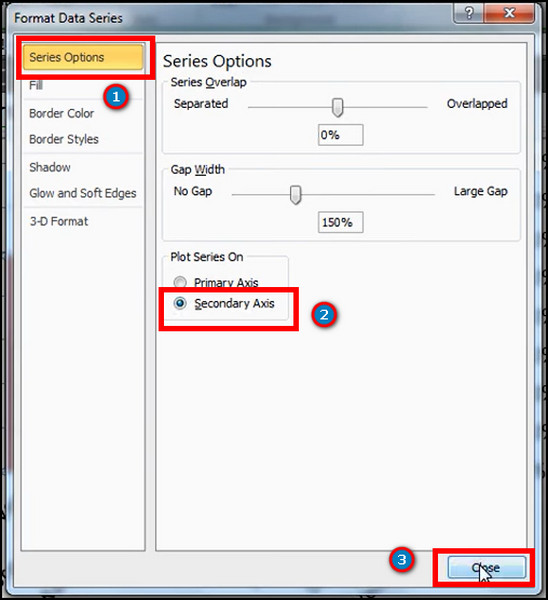
- Go to Series Option from the Format Data Series dialogue window.
- Select the radio button beside the Secondary Axis.
- Click on Close.
The secondary axis of your selected series will appear on the chart. As a Mac user, you will find the procedure to add a secondary axis in Excel in the following passage.
Read more on how to autofill dates in MS Excel.
How to Add a Secondary Axis in Excel for Mac
Selecting the Secondary Axis from Series Options, you can add a secondary axis to your chart. The process is dissimilar in macOS to Windows. Allow me to guide you through the process of how to add a secondary axis on Mac.
Here are the ways to add a secondary axis in Excel for Mac:
- Launch Microsoft Excel on Mac.
- Open the Excel datasheet.
- Select the data range.
- Navigate to Insert and add a chart.
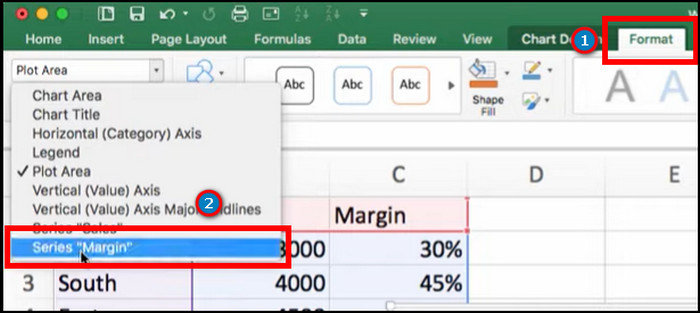
- Go to the Format tab.
- Select the drop-down menu and select data series.
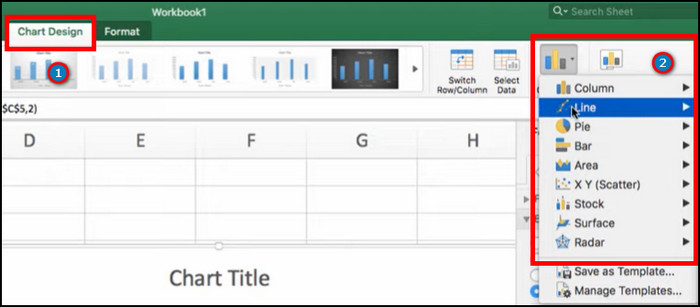
- Go to Chart Design and click on Change Chart Type.
- Change the chart type.
- Double-click on the series.
- Go to Series Options from the right pane.
- Click the radio button beside the Secondary Axis.
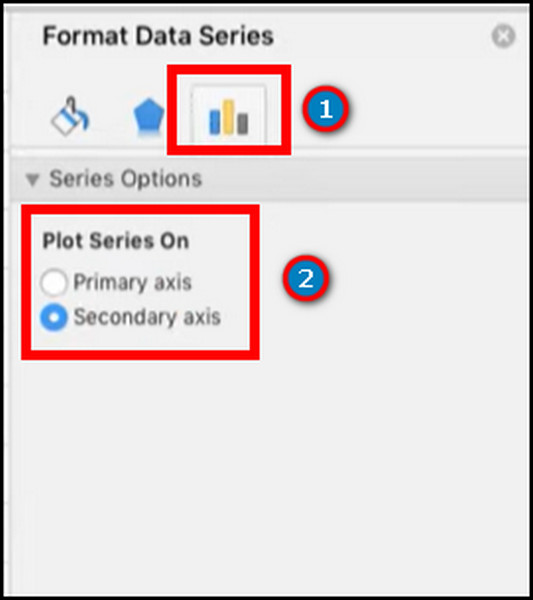
This procedure will add a secondary axis to your data chart. Also, selecting the series helps when the series is tiny to click on. Read the following steps to change the secondary axis type in Excel.
Also, related to this guide is how to add borders in Microsoft Excel.
How to Change Secondary Axis Chart Type in Excel
Microsoft Excel provides a variety of choices for selecting the secondary axis chart type. Excel has columns, lines, pies, bars and other charts. You can choose different types based on the circumstance of your chart.
Windows and Mac both have the option to change the secondary axis type. Follow the steps below to learn about them.
Here are the methods to change the secondary axis chart type in Excel on Windows:
- Go to MS Excel from Windows.
- Open the datasheet and go to the chart.
- Click on the secondary axis series from the chart.
- Navigate to the Chart Design tab.
- Press on the Change Chart Type option.
- Go to the Combo section from the left pane.
- Press the drop-down menu from Chart Type beside the Series Name.
- Choose your preferred chart type.
- Click on OK to confirm the changes.
Before changing the chart type, you can see a preview of the changes in the Change Chart Type dialogue box.
Here are the ways to change the secondary axis chart type in Excel on Mac:
- Launch Microsoft Excel from your Mac.
- Open the Excel datasheet and navigate to the chart.
- Click on the secondary axis series.
- Go to the Change Chart Type option from Chart Design.
- Hover over a chart category and click on the type.
It will change the secondary axis series chart style on Mac. If you want to add a secondary axis title, consider following the instructions below.
How to Add Secondary Axis Title in Excel
Adding the secondary axis title from Chart Elements helps the user better understand the chart. You can add the axis title in Windows by checking the title box.
However, you need to add horizontal and vertical axis titles differently on Mac. You’ll find the secondary axis addition process below.
Here are the steps to change Add axis title in Excel on Windows:
- Open the Excel datasheet and go to your chart.
- Click anywhere on the chart.
- Press on the Chart Elements ( + ) option.
- Check the box beside Axis Titles.
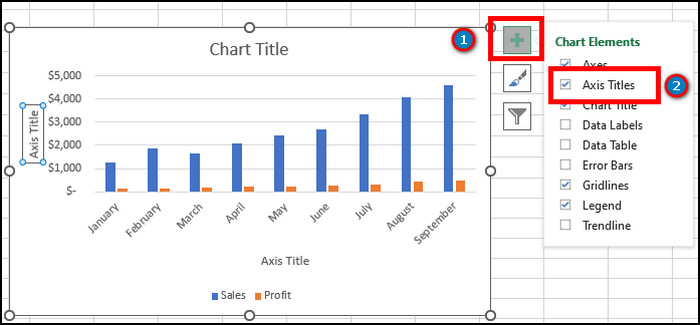
Checking the option will add an axis title to your chart. You can also click on the title box to rename it. If using a Mac device, follow the procedures below to add the secondary axis title.
Here are the ways to add a secondary axis title on Mac:
- Launch Excel on Mac.
- Go to your datasheet.
- Press anywhere on the chart.
- Click on the Chart Design tab from the top ribbon.
- Press on the Add Chart Element option.
- Hover on Axis Title and click on Primary Horizontal to add a horizontal title.
- Hover on Axis Title and click on Primary Vertical to add a vertical title.
![mac-add-axis-title]](https://10pcg.com/wp-content/uploads/mac-add-axis-title-2.jpg)
You can also change the title name by renaming them. Read the following procedures to remove the secondary axis in Excel.
How to Remove Secondary Axis in Excel
If you mistakenly want to remove or add the secondary axis, you can remove them by pressing the Delete button. The process is similar in both Windows and Mac. Consider reading the procedure below to remove the secondary axis from your chart.
Here is the process to remove the secondary axis in Excel on Windows:
- Go to the datasheet from Excel on Windows.
- Click on the secondary axis.
- Right-click and press the Delete
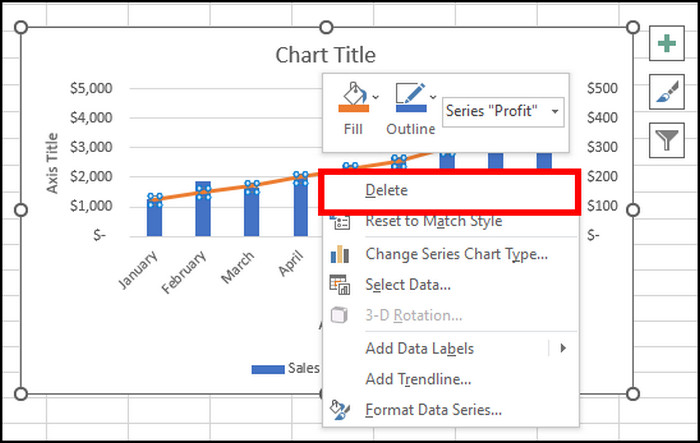
It will remove/delete the secondary axis from the chart. Also, you can press the Delete button from the keyboard to remove it. If you are a Mac user, follow the instructions below to learn about the ways to remove the secondary axis.
Here is the method to remove the secondary axis in Excel on Mac:
- Open MS Excel on Mac.
- Go to the chart from your datasheet.
- Click on the secondary axis.
- Press the Delete button from your keyboard.
This process will delete the secondary axis from your chart. You can also undo the process if you’ve just added the secondary axis.
Frequently Asked Question
What is the secondary axis in Excel?
The secondary axis in Excel uses the same X axis with two sets of Y-axis data with two different scales.
Why won’t Excel let me add a secondary axis?
MS Excel requires multiple data series to add a secondary axis. It won’t let the user add a secondary axis if only one data series exists.
Is there a secondary axis option in mobile?
No, the secondary axis option isn’t available on Android and iOS. It’s only available in Windows and Mac application.
Conclusions
Adding a secondary axis gives a minimalistic look to the datasheet and represents multiple values in a chart.
This article provides a step-by-step guide to adding the secondary axis to your Mac & Windows, and I hope you are using the feature to simplify your Excel datasheet.
Don’t forget to share your experience after using the feature in the comment box below.
Cheers!