T charts are generally used to compare & contrast two different aspects, like the advantages & disadvantages of a particular thing. The reason why it’s called a T chart is because the chart kind of resembles the letter T.
And the process of making this sort of chart is as simple as its name.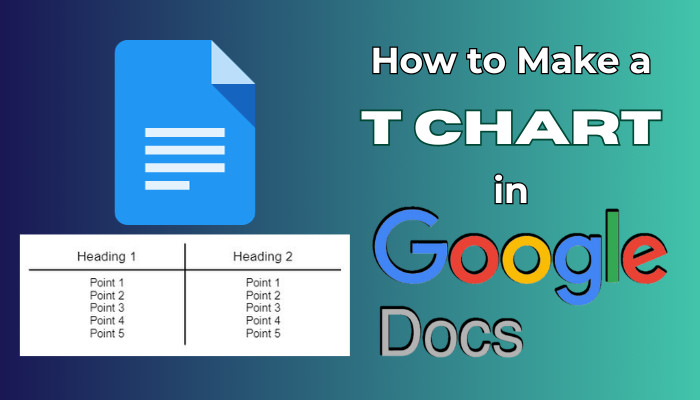
So, let’s go through this write-up & find out the easiest way of making a T chart in a document.
How to Create T Chart in Google Docs
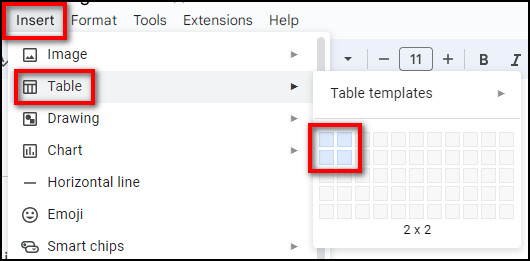
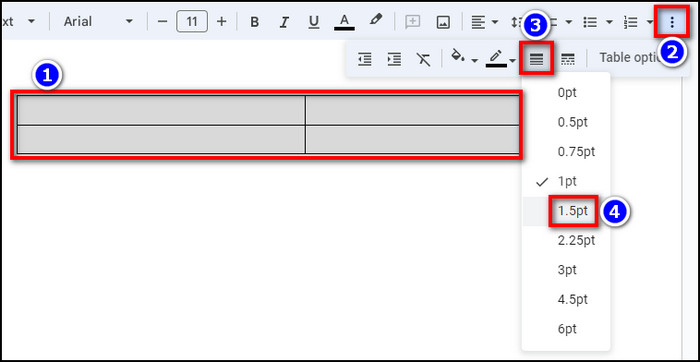
To create a T chart in Google Docs, select Insert > Table & make a 2×2 table. Select the entire table & click on the three-dot icon on the toolbar. Now, set the Border width to 1.5pt & type the contents in the table. Then, remove the outer borders of the table to create a T-shaped chart.
A T chart allows users to visualize data in a side-by-side comparison format, which in turn helps to make a well-informed decision. But knowing how to make a template for such a chart is important, no matter the purpose.
Follow these steps to make a T chart in Google Docs:
- Open your Google document and place the cursor where you want to insert the T chart.
- Click on Insert > Table and choose a 2×2 table.
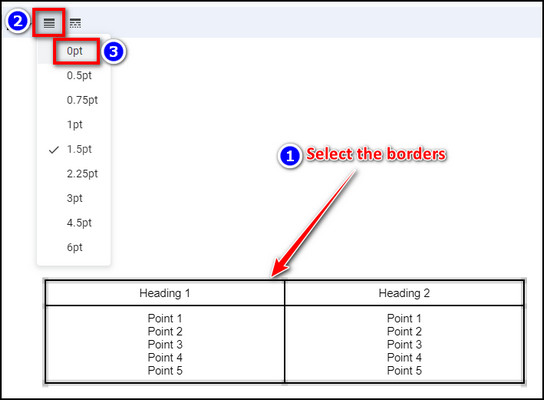
- Highlight the entire table and click on the three-dot icon from the toolbar.
- Select Border width > 1.5pt to make the borders thicker.
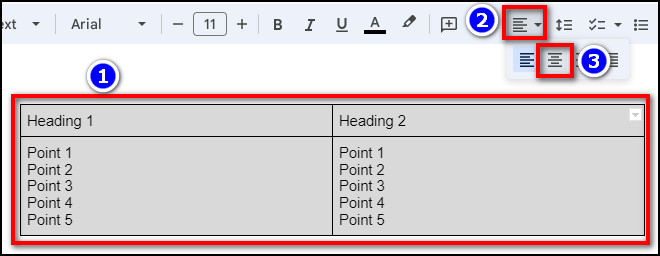
- Type in the headings & other contents of your chart.
- Click on Align > Center align from the toolbar.
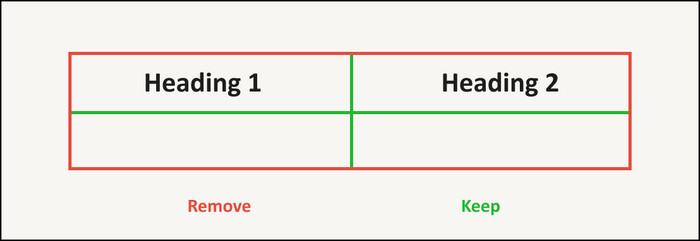
- Select the outer table borders by using the Ctrl+Mouse 1(left click) button.
- Click on the three-dot icon from the toolbar and select Border width > 0pt.
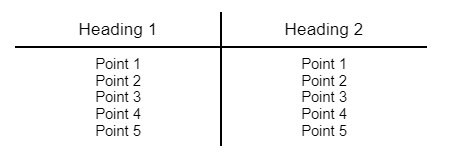
Done! You can also increase the font size of the headings to fine-tune the overall look. After that, the end result should look something like this:
Now, you might be wondering, does Google Docs have a chart template?
Unfortunately, there are no built-in T-chart templates in Google Docs. But you can use the above-posted chart as a free template and copy-paste it into your document. In case the copy-paste function stops working in Google Docs, refer to the embedded article.
In short, create a 2×2 table in Google Docs and enter the headings with center aligned. Then, increase the border thickness and remove the outer borders of the table to get a T-shaped chart. Refer to the attached image for better understanding.
What is the Purpose of Making a T-Chart in Google Docs?
There are various scenarios where a T chart can be quite useful, such as categorizing a set of data, demonstrating changes in a newer software/hardware version, etc. It is mainly a side-by-side comparison table, so the use case for such a chart is limitless.
Nonetheless, here are some of the purposes for making a T chart in Google Docs:
- Evaluate the pros and cons of a particular subject/object.
- Advertise/visually represent noteworthy changes.
- Sort a set of information based on two different categories.
- Listing problems along with their corresponding solutions.
- Comparison table for two or more items(double T-chart).
These are not only the benefits but also the suitable situations for inserting a T-chart in your Google documents. Furthermore, this table tinkering method can also be used to make matrices in Google Docs.
Frequently Asked Questions
Are there any T chart templates in Google Docs?
No. There aren’t any templates to make a T-chart in Google Docs. Just create a 2×2 table and remove the borders. It’ll create a chart that looks like the letter T. It’s that simple, hence why there’s no need for a template.
What are the limitations of a T chart in Google Docs?
Since a T-chart is nothing but a simple 2×2 table, its limitations kind of linger around that aspect. Just like all the other table formats, it lacks graphical tools, complexity, or integration with other Workspace tools, i.e. Google Sheets.
Can you insert a note-taking T-chart in a document?
Yes. You can insert a note-taking T-chart in a Google document. It’s format is not really any different compared to a normal one; it’s just the purpose & headings that differentiate these charts.
Conclusion
Long story short, tinkering a table and removing its outer borders will give you a T-shaped chart that is perfect for tabulated data comparison. It’s not as fancy as the charts from Google Sheets, but it’ll serve the intended purpose just fine.
And that’s all she wrote. Simply go through this write-up & you’ll easily put together a T-chart in no time.
Adios!