Suppose you’re showing a traditionally created report, and your employer asks you to show a particular department’s total cost and revenue. You’d have to ask for additional time to create a new report based on those demands, which, let’s be honest, is quite embarrassing.
For such scenarios, you could get away with only if you used the drill-through feature while creating the report with Power BI. But that’s easier said than done.
So, to help you in this regard, let’s go through this step-by-step tutorial on utilizing drill through in Power BI.
What is Drill Through in Power BI?
Drillthrough is a data visualization feature in Power BI that allows users to create a link between two report pages. This allows us to see or fetch the details of a specific data point or entity from another page.
For example, let’s assume you have a page showing different product sales. You can create a drill-through to another page showing product details, like reviews, descriptions, or prices.
When you right-click on a product name on the first page, you can drill through to the second page and see the information filtered to that product.
Just like any other function in Power BI, there are some prerequisites for using drill-through in your data set. On that note, you need to have a specified field/drill-through button, along with target pages and corresponding data points, to make an interactive report.
Basic Functionality of Drill Through Feature in Power BI
In Power BI, the drill-through feature basically generates interactive reports with clickable hyperlinks, which bring the user to a more detailed view compared to the previous summary report.
Under the hood, it uses a target page containing the visuals for the desired entity or data point.
Furthermore, you can specify the fields you want to use for drilling and custom/personalized visualization while creating a drill-through report.
Not to mention you can also pass filters from the report overview to the in-depth report page.
In simple words, this allows users to click on a data point from the summary report and go to a specific context menu based on the selected drillthrough filter.
Benefits of Using Drillthrough in Power BI
While there are plenty of useful options in Microsoft’s Power BI service, the drill-through element easily stands out from those features, and for good reasons as well.
Here’s why drill-through is an important aspect of Power BI:
- Navigate easily and quickly from compressed summary reports to detailed information without creating multiple dashboards or report pages.
- Drill down into any precise data points and review data in detail.
- It helps users to uncover hidden patterns for better decision-making.
- Swiftly view and compare different data sets and factors.
- Customized drill-through filters allow users to slice and dice multiple data sets as they please.
Think of it more like an expansion button; you click on a data point and get a detailed page filtered with the selected context.
As a result, you get the luxury of drilling down into individual information without having to manually apply filters and navigate through large data sets.
How to Use Drill Through in Power BI Reports
To use this feature, you need to follow some precise steps and create the whole report with the drilling filter in mind, which I have further elaborated on in a step-by-step manner.
Here’s how to add drill through to your Power BI reports:
Step 1: Enable Modern Visual Tooltips
By default, the visual tooltips pop-up, which shows the drill-through option, is disabled from the Power BI Settings. So, to use this feature, you need to enable the aforementioned option first. Otherwise, the Power BI drill-through won’t show up.
Follow these steps to enable modern visual tooltips in Power BI:
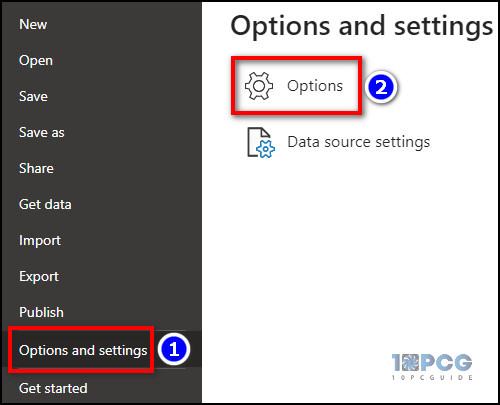
- Launch the Power BI app on your device and click on File > Options and settings > Options.
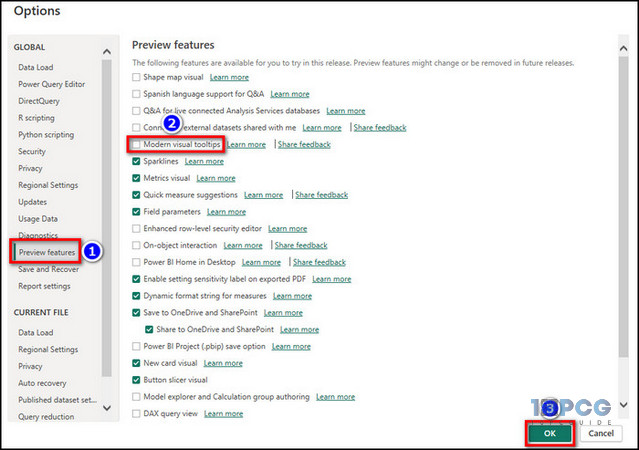
- Click on the Preview features from the left side pane.
- Tick the box for Modern Visual Tooltips and hit OK.
Done! This will show the drill through a pop-up when a user hovers over a report field or right-click on it. Not to mention, this method is also useful when the Power BI drill-through is not working.
Now, the real work begins.
Step 2: Create an Intuitive Dashboard Page
As I’ve previously mentioned, you need to start setting up the report in a way that is drill-through friendly. Hence, the second thing you need to do in this regard is to create a high-level report page in the dashboard and continue from there.
To do so:
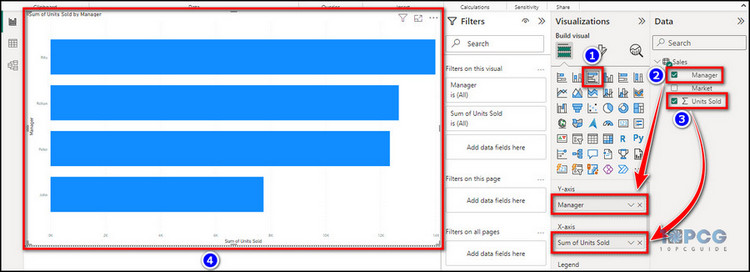
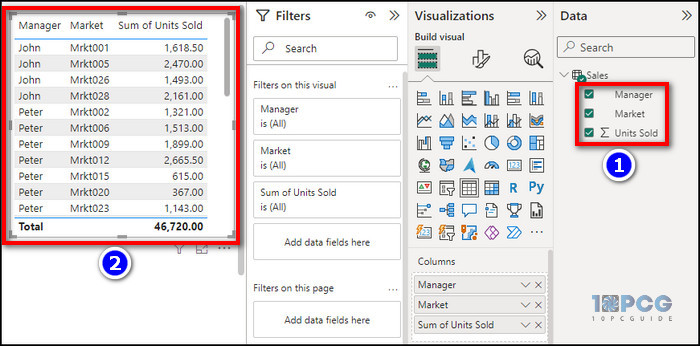
- Click on Get data and load up the data table from Excel or other sources. For demonstration, I have a sales table containing Manager, Market, and Units Sold values.
- Go to the Report view section and select the Clustered bar chart from the Visualization section.
- Tick the boxes for Manager and Units Sold from the Data At the end of this process, our chart should look something like the embedded image where the Y axis is Manager, and the X axis is Sum of Units Sold.
It goes without saying that you can select any kind of chart for the visualization; you don’t have to pick the one I did.
Nonetheless, the aim of this step is to make sure that the dashboard report page contains high-level information. As a result, it can act as a launch pad for the detailed pages after we drill them down.
Step 3: Set Up Target/Detail Pages for Drill Through
Next up, you need to create a drill-through details page where the users will be taken after clicking on the subsequent field from the summary page. Here’s how:
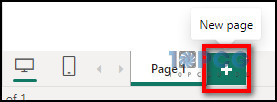
- Click on the New page icon(+) next to Page 1.
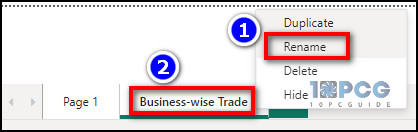
- Right-click on Page 2 and select Rename. Set it as Business-wise trade or whatever you want.
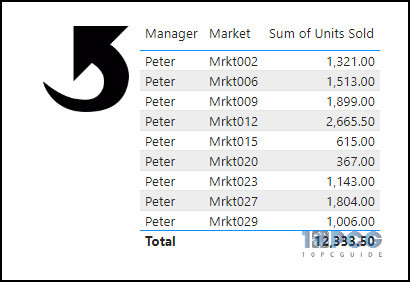
- Tick all the boxes for the Manager, Market, and Sum of Units Sold from the Data section, which would give us a summary table.
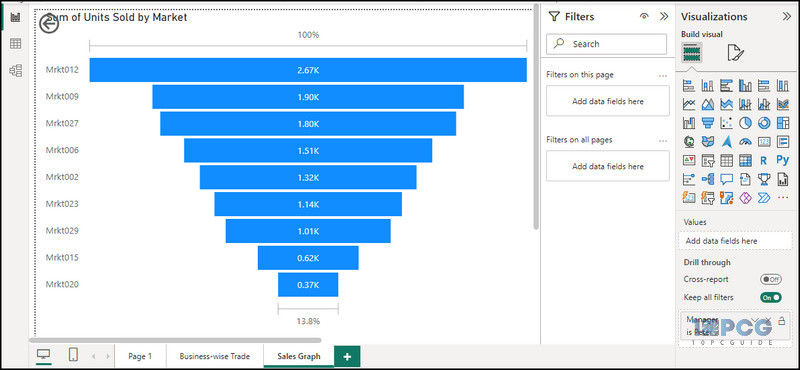
- Click on the New page icon to create another page and name it Sales Graph.
- Select the Funnel chart from the Visualization section.
- Drag and drop Market to Category and Units Sold to Values field.
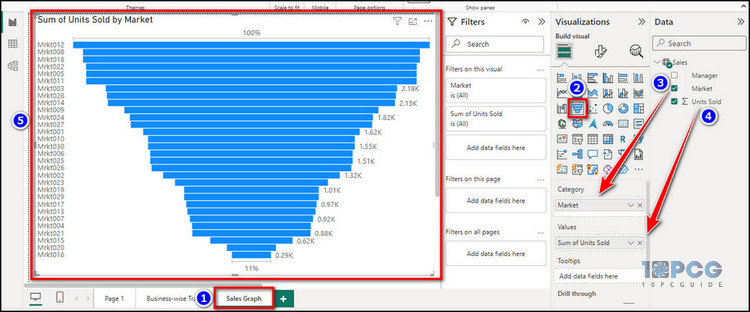
That’s it. The end result should look something like the embedded image.
Step 4: Add Drill Through Filters/Logic
As per our example, we want to see the break-up values for each manager and check how they performed without manually creating new tables for each one. Hence, the drilling needs to go through Manager-wise.
And for that, we need to add Manager as the drill-through logic/filter for each page. Here’s how:
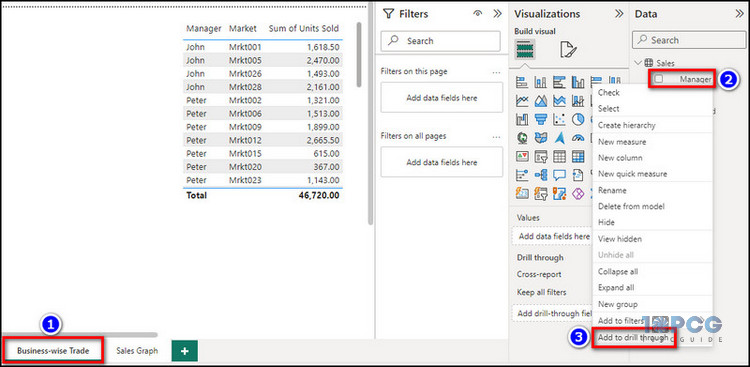
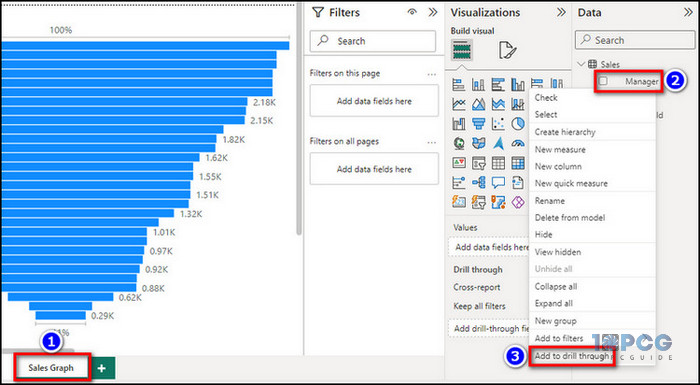
- Go to the Business-wise Trade page and right-click on the Manager model from the Data section.
- Select Add to drillthrough. Now, it would show Manager in the Drillthrough filter pane.
- Navigate to the Sales Graph page and right-click on the Manager data model.
- Choose Add to drillthrough, which would show the Manager column in the Drillthrough filter pane.
One thing you would immediately notice is that a new back button will appear on each page as soon as you add a Power BI drill-through button, which brings us to our next step.
Step 4(Optional): Change the Back Button Image
The aforementioned back button works as the name suggests; when you click on it, you’ll go back to the summary/report page. For convenience and extra flare, Microsoft has made it completely customizable.
Keep in mind, this customization is entirely optional, and you can just get by with the built-in one.
Nonetheless, let’s see how you can change the back button of a drill-through page:
- Go to a detail page, like Business-wise Trade, and right-click on the default go-back button.
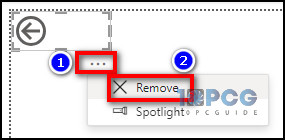
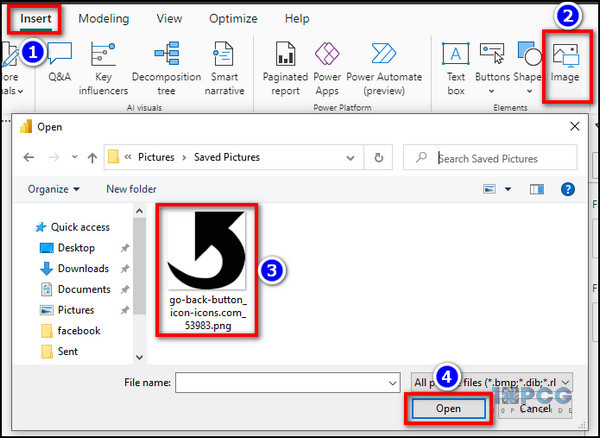
- Select Remove and click on the Insert tab from the top ribbon.
- Select Image from the Elements section.
- Choose a custom image from your computer and click on Open.
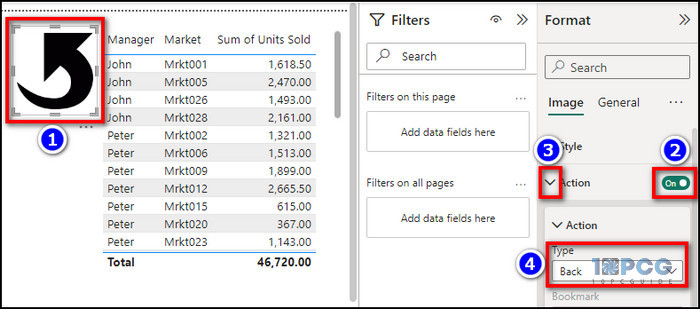
- Position the image accordingly and enable the Action mode from the Format section.
- Expand the Action drop-down menu and set the Type as Back.
That’s it. Now, do the same for Sales Graph as well.
Step 5(Optional): Pass All Filters in the Drill Through
While adding a drill-through field, you might have noticed that there is a toggle called Keep all filters. This toggle should be enabled by default.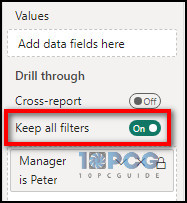
But, in case it’s not toggled on, users have the choice to enable it and employ all the currently applied filters from the source report view to the detailed/drill-through pages.
Additionally, you can add a measured numeric column to the detailed view. It would help you navigate to the desired page when such a summarized column is added to the report view.
Just like the last step, these are all optional. So don’t bother too much with these kinds of stuff if you don’t need them. Because our drilling has already been done.
Check the Functionality of the Drill Through Report
For our example of drill-through in Power BI, let’s see how effectively this newly created clickable report page works.
Follow these steps to check the functionality of the drill-through report in Power BI:
- Navigate to Page 1 or the summary report and right-click on a field/bar from the chart. For demonstration, we want to see how Peter has done in both sales. So, we will right-click on the bar for Peter.
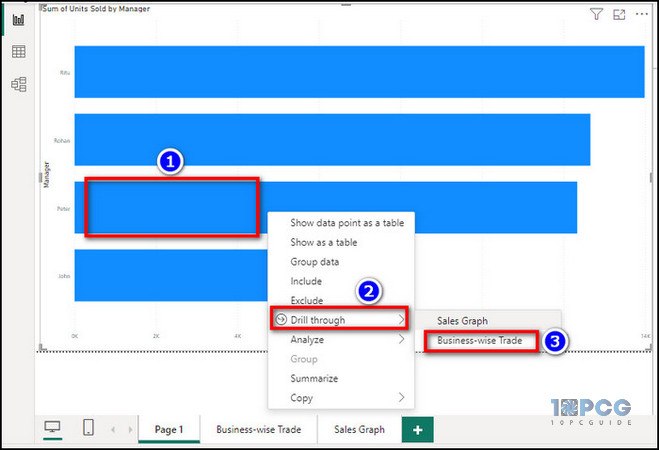
- Select Drillthrough > Business-wise Trade to check how the market-wise sales were for Peter. It will take us to the Business-wise Trade page but only show the filtered values for Peter.
- CTRL+click on the back button that we previously added to go back to the summary page.
- Right-click on Peter’s bar again and select Drillthrough > Sales Graph to check the visual representation of Peter’s performance.
As we can see, the drill-through is working exactly as we intended to do. We can successfully drill through the data table to get only the values of specific managers.
And the best part is, we didn’t have to create those filtered tables manually.
How to Use Cross Report Drill Through in Power BI
Besides drilling through to another page in the same Power BI report, users can also utilize this feature across different reports in the same workspace environment.
By doing so, you can open a specific target page from a target report without having to scrub through resources to find that data.
Here’s how to use cross-report drilling in Power BI:
1. Enable Cross-Report Drilling for Power BI Settings
- Run the Power BI app and click on File > Options and settings > Options.
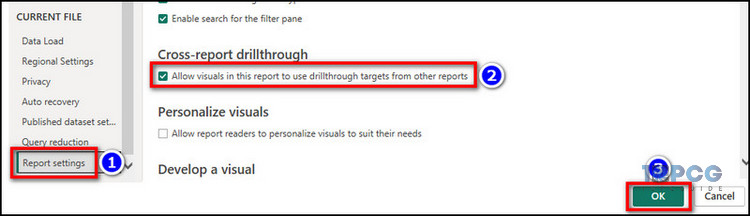
- Select Report settings from the Current File section.
- Tick the box for the Cross-report drillthrough option and hit OK.
2. Enable Cross-Report Drilling from the Power BI Service
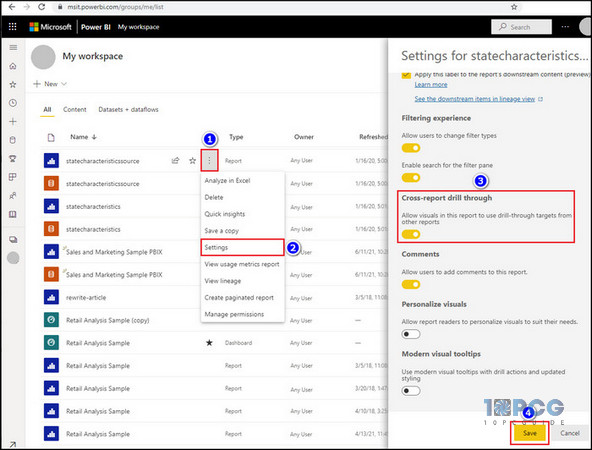
- Go to your Power BI workspace and select the environment where the reports are stored.
- Click on the three-dot icon and select Settings.
- Scroll down to the Cross-report drill through section.
- Enable the toggle for Allow visuals in this report to use drill-through targets from other reports.
- Click on Save.
3. Setup Cross Report Drill-Through
- Open the Power BI report that you’re gonna use as the target report for drilling.
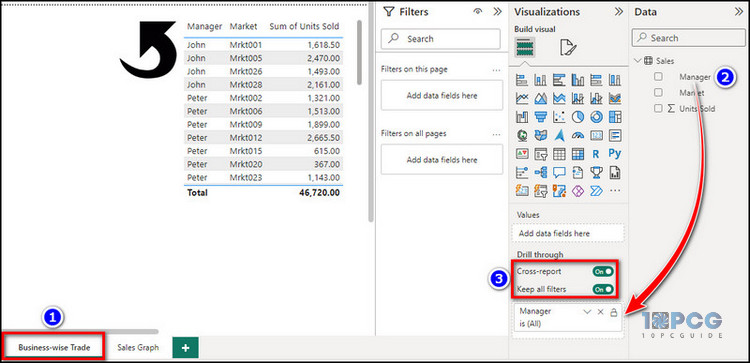
- Go to the target page containing the desired info and right-click on the target data model. For our demo, we’ve selected the Business-wise Trade page and selected the Manager column for drilling.
- Select Add to drillthrough and enable the Cross-report toggle from the Drillthrough filter field.
- Choose whether you want to use the field as a category or summary on the report page. This step is optional, so you can skip it if you want to.
- Delete the automatically created back button, as it only works for going to the source page from the same report.
Done! Now, all you need to do is save the changes before closing/publishing the report.
Now, to use the newly created drilled page on another report, open the source report from the same workspace and click on any visual field that is related to the specified Manager values from our setup process.
After that, you’ll see a drill-through option in the context menu. Select that option, and it will show our report and target page like Business-wise Trade [Drill Through]. That’s it.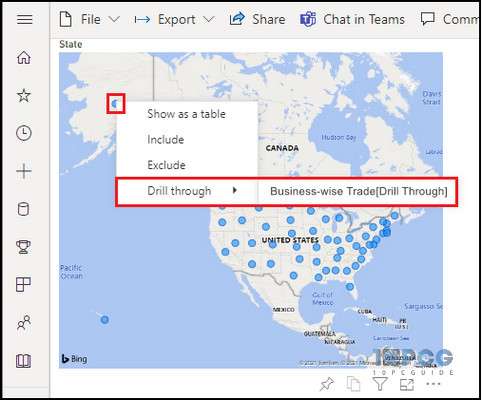
Enhance and Optimize Drill Through Visualization
Now that we’ve successfully created and used the drill-through feature in our Power BI reports, let’s see what we can do to make them more intuitive or optimized.
Add a Button on the Report Page for One-Click Drill-Through
This method is most useful when you want to use Power BI drill-through without right-clicking. To implement such a cool feature, select a bar and go to Insert > Elements > Buttons > Blank Button.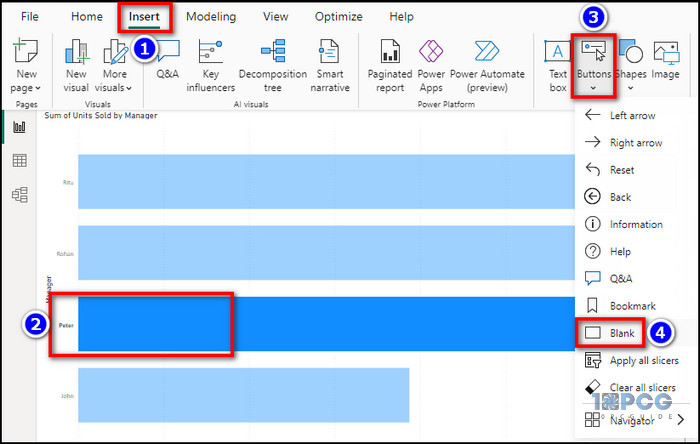
Then, choose Format > Button > Action and set the Type to Drillthrough and Destination to Business–wise Trade or Sales Graph.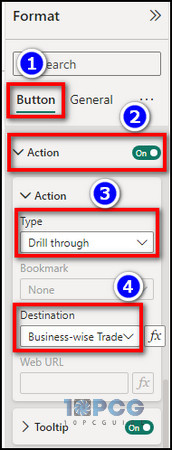
You can further customize the display text within the button from the Style section.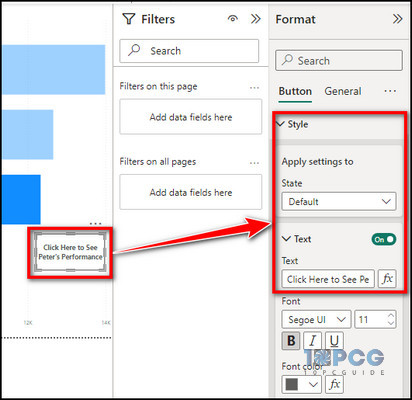
After you’re done, you’ll see the newly added action button next to the highlighted bar.
Use Bookmarks or Parameters for the Drill Through Page
Saving the drill through states as bookmarks is an effective way to share and reuse them to create a high-level summary report.
Not to mention, dynamic parameters allow users to manipulate data to sort the values in a drill-through-friendly manner. As a result, the entire process of creating a dynamic/clickable report card becomes much easier.
Additionally, make sure to implement the data modeling in Power BI properly. Otherwise, the aforementioned process will come to a halt and you’d end up wondering what went wrong.
Limitations of Drillthrough for Power BI Reports
Despite being a powerful data analysis feature, it has some noteworthy limitations that you need to know if you’re interested in using drill-through in your Power BI reports. Such as:
- Drill through only works when you have a properly organized and optimized data model.
- This function won’t work in case you have complex data sets with no correlation with each other.
- You won’t be able to apply cross-report drilling when it comes to Power BI Report Server.
- Cross-report drilling is only possible for the workspaces where you’re a member.
These can be a dealbreaker for some users, but for the most part, these limitations can be overcome by troubleshooting common issues and following the best practices for using drill-through.
Wrapping Things Up
Using drill-through in Power BI is most effective when you have multiple correlated data tables. No matter the use case, following this write-up and keeping an eye on the prerequisites of the drill-through filters should set you on the correct path.
Anyway, for any further assistance on Power BI-related queries, don’t forget to visit our website.
Have a good one!