If you deal with Power BI, you have heard about data modeling. It is a fundamental pillar for creating efficient and insightful reports and visualizations.
The Power BI data model helps organizations analyze data and make the right decisions through visual insights. So, improving data modeling key concepts and techniques will help make an effective report and get a beneficial output.
Here, you will learn the importance of Power BI data modeling, how to build efficient data models, and recommended optimization.
Let’s dive in.
What is Data Modeling in Power BI?
Data modeling in Power BI is a feature that connects several data sources. We often get data in multiple tables from the same or various sources, like in .xml or .csv files.
You must build a relationship between the tables to communicate with each other, and you will get some output from there. The relationship indicates how data sources are connected, and it is known as data modeling. 
This exercise will help you analyze and define all the different data types and create visual data representations.
For example, take a look at the following tables. The top table contains ID numbers, car names, and car types, whereas the bottom has ID number 2, car IDs, models, and color records.
| Table 1 | ||
|---|---|---|
| ID number | Car name | Car Type |
| A1 | Audi R8 | Sports |
| A2 | Audi R8 | Sports |
| A3 | Cadillac Catera | Sedan |
| Table 2 | |||
|---|---|---|---|
| ID number 2 | Car ID | Car Model | Car Color |
| A | A1 | Model 2 | Green |
| B | A1 | Model 2 | Grey |
| C | A2 | Model 4 | Matte |
Here, the ID number is identified as a unique record and considered a primary key, as it is not repetitive. On the other hand, Car ID in the second table is considered a foreign key that makes relations with Table 1.
Now, to understand the relation types, you should know about cardinality. Cardinality is the number of relations from one data source to another. Generally, three cardinality types are mostly used in Power BI.
- One to One Cardinality: Similar to the name, this cardinality type builds one connection with the other table’s data.
- One to Many Cardinality: This cardinality allows you to make multiple connections with one data. For example, A1(ID number) from Table 1 creates multiple links with Table 2 (Car ID).
- Many to Many Cardinality: In this cardinality, multiple data from one table can create relations with several data in the other table. The Audi R8(Car name) in Table 1 generates multiple links in Table 2’s Car Model column.
Why and When Do You Use the Power BI Data Model?
Data modeling allows for organizing data into different tables while establishing relationships between them through a common column. The primary goal of the Power BI Data Model is to enable the users to navigate data without writing the same queries every time.
Here are some benefits of data modeling in Power BI:
- Helps to collaborate with IT and business teams by making a design.
- Points out where a business improvement is needed.
- Helps to make appropriate projects and save time and money.
- Improves data integrity with fewer errors.
- Enhance the data retrieval process.
The data model supports you with efficient data exploration and lets you identify business trends. So, you must make and use well-organized data models when data retrieval speed matters.
In addition, if you tend to maintain reports for a longer period, making a well-designed data model will ensure easier future maintenance with more accurate reports.
Types of Data Modelling in Power BI
Now that you have learned the introduction to data modeling in Power BI. Let’s talk about the three different data modelling types as examples.
- Conceptual data modeling: This model specifies an overall business structure. It helps to understand and represent the relationships between different entities within a business or system.
Suppose you have clients, workers, and item data. These data are the entities that create relationships with other entities. Both the entities and the entity relationships are defined within the conceptual data model.
- Logical data modeling: This model creates a detailed data representation that accurately reflects the business requirements. For example, Client A purchases Item B from Salesman C. It is more of a technical model that helps to make decisions.
- Physical data modeling: Developers use the physical data model to implement the logical data model. Here, the focus shifts to the technical aspects of database design and optimization for performance.
How to Make Power BI Data Model
Before building a Power BI data model, you must learn about the structure layout. After that, you can import the data, make and manage relationships, calculate the data, and finally display the visualization on the Power BI dashboard.
Here are the methods to make a Power BI Data Model:
Layout in Data Model
There are three common approaches to laying out a data model. Depending on the structure, the name varies.
1. Star Schema
A star schema data model has a fact table and several dimension tables positioned around it. Similar to the name, it looks like a star where the fact table stays in the center, and the dimension tables stay at the points of the star. 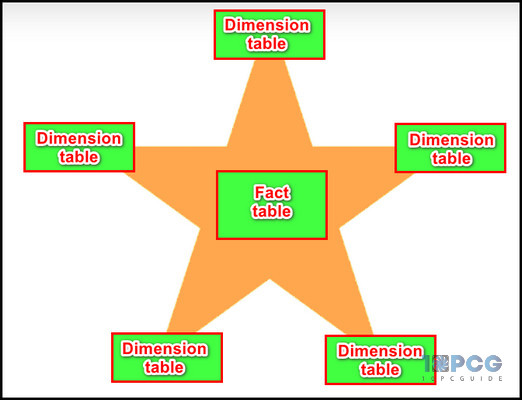
The following example model displays a star schema where the Sales table is the fact table, and the others are the dimensions table, which resembles a star. 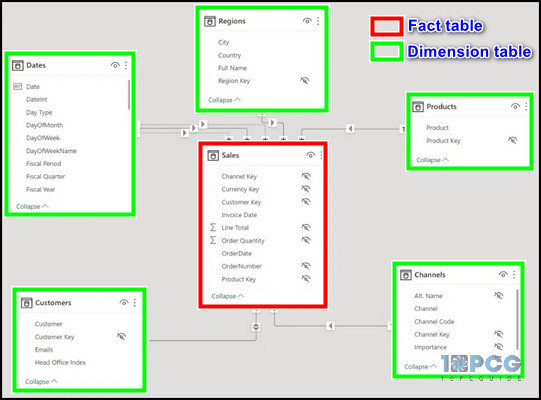
2. Snowflake Schema
This data model approach is similar to the star schema. But the main difference is that the star structure has all hierarchy levels in the same table. On the other hand, the snowflake schema breaks up the hierarchy levels into several tables. 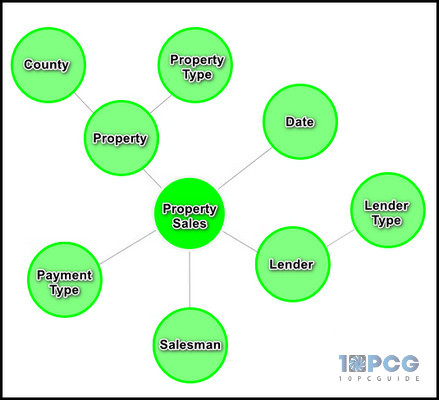
From the structure, you can see the Lender and the Property dimension table breaks into other dimension tables. The Property Sales is the fact table and remains the same.
3. Waterfall Schema
The third layout for the Power BI data model is the waterfall approach. The difference with this type is the fact tables stay at the bottom, whereas the lookup tables are arranged in a row at the top. 
This visual looks like the dimensions tables are falling to the fact table, hence the name waterfall.
You have to choose a proper schema from these models depending on the source data and your visual target. Now, it’s time to import source data in the Power BI discussed below.
Import Sample Data in Power BI
To make a data model, you will need data files. In Power BI, you can import various types of data. I will use an Excel file containing shop sale records for this tutorial. You can download the file from below for practice. The practice book has customer information, country, date, cost, etc.
Download the Shop Record Sample Data→If the source data file contains some relation, Power BI identifies the data and its relation in a table automatically.
Here are the steps to import source data in Power BI:
- Open the Power BI Desktop app.
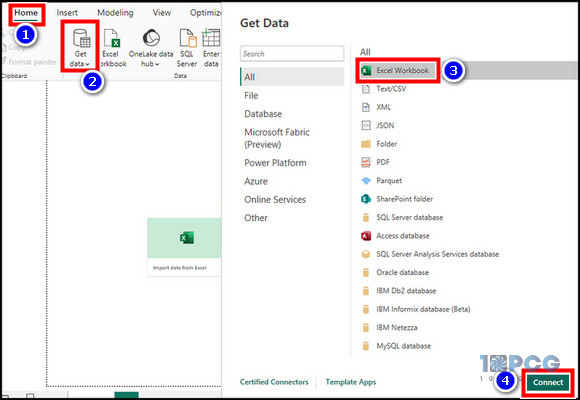
- Click Get data from the data group under the Home tab.
- Select the file type you want to import and hit Connect. For this tutorial, choose the Excel workbook.
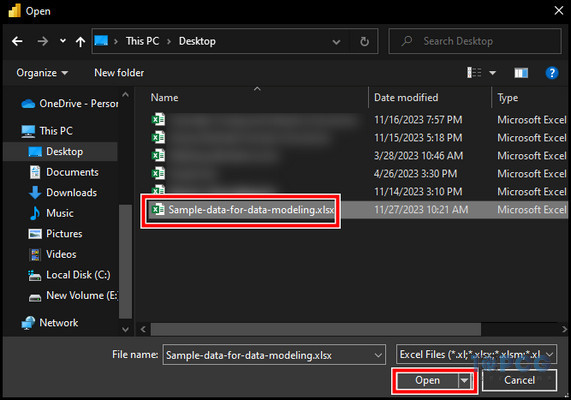
- Pick your source data file and hit Open.
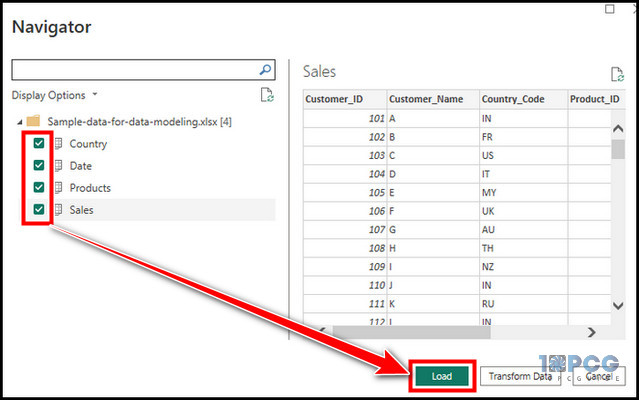
- Select all the data from the left and click Load.
Loading all the data will take a while, so wait patiently. After loading the data, it’s time to view and manage the data model by creating relationships. So continue reading.
Model View in Power BI
In Power BI, there are three view modes in the left pane. The top one is the Report view, which allows you to create a visualization in the Power BI dashboard. The middle one is the Table view where you can create and manage imported data.
The bottom view is the one where you will see the data models and relationships. This tab is called Model view.
After importing the source data, you can see that Power BI already made some relationships between the tables. The visible lines that connect the tables are called cardinality. You will also see a direction icon that indicates the relation direction.
As the model is incomplete, you must manually create and manage relationships between the tables depending on your needs.
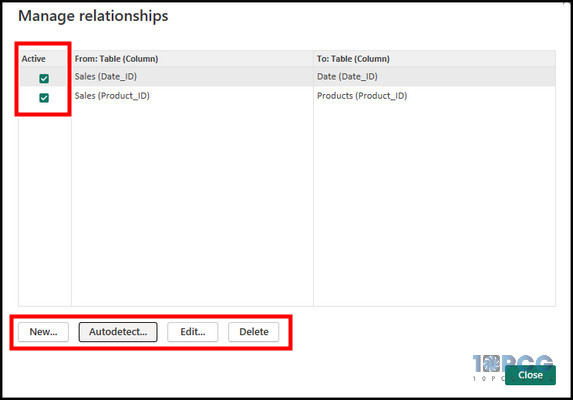
Manage Relationships in Power BI
There are four options related to relationships in Power BI. You can build a new one, delete some, or modify them if required. You can also use the Autodetect option, which will try to detect the data relationships between tables automatically.
To create and manage Power BI relationships:
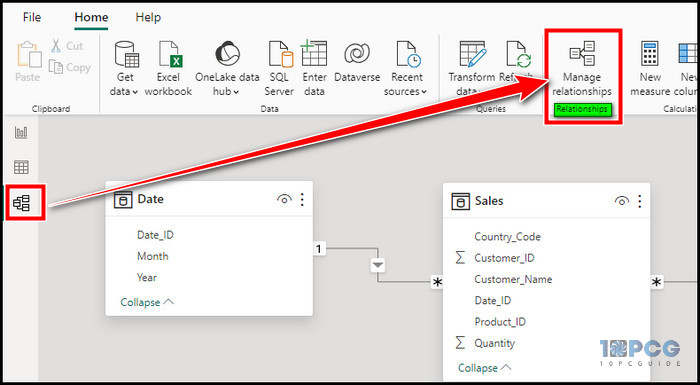
- Go to the Model view.
- Click on Manage relationships from the Relationships group.
- Select which relationships you want to be active or inactive from the Active column. You can choose other options from the below.
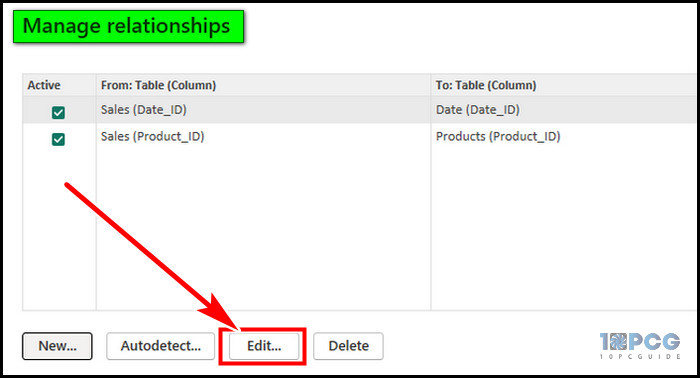
The Add and Edit window screen is similar. For the tutorial, I’m showing the edit option.
Here’s the process to edit a relationship in Power BI:
- Click on Edit from the Manage relationship window.
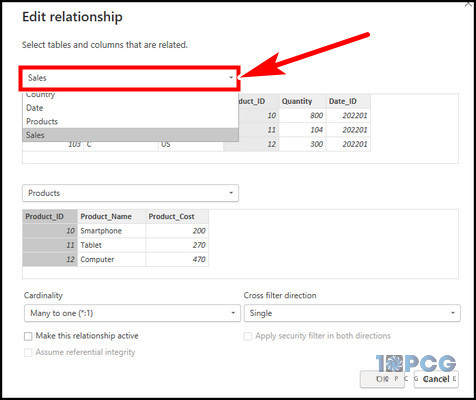
- Select a table from where you want to make the relation in the first drop-down.
- Pick a table in the second dropdown to build a relation to it from the first table.
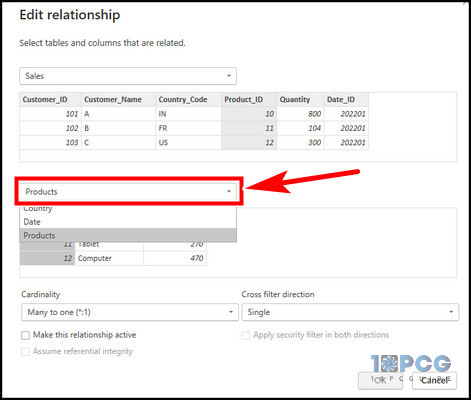
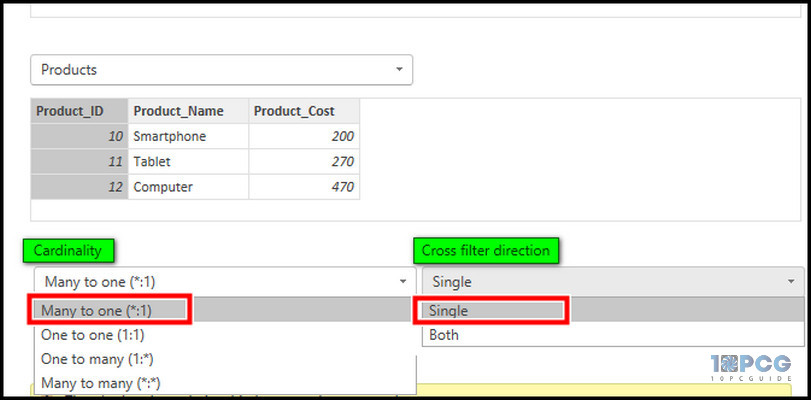
- Choose a suitable Cardinality relation.
- Select the relationship direction (Single or Both) from the Cross filter direction dropdown.
After creating or editing a relationship, you have to calculate and measure data with some expression.
Calculate and Measure Power BI Data
You have to use the Power BI DAX formula to calculate data from the tables. DAX (Data Analysis Expression) is a formula and includes commands for various filters.
Follow the process below to calculate in Power BI:
- Go to the Table view from the left pane.
- Click on the New table from the Calculations group from the top.
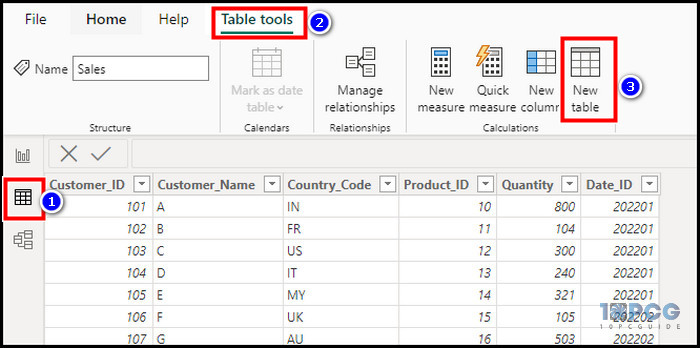
- Enter the following formula in the formula bar.
Country_Revenue = DISTINCT(Country[Country_Code])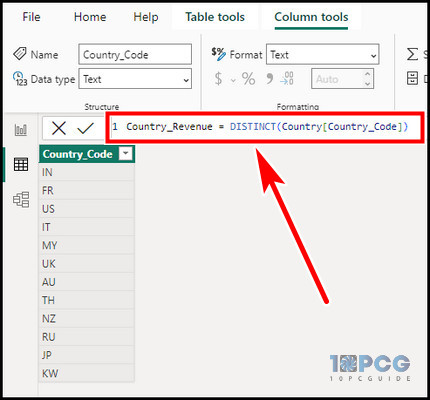
- Hit Enter.
Here, in the formula, Country_Revenue is the table name. With the rest of the formula, you indicate to import the Country_Code column from the Country table. You can click twice on the column header to rename it.
Now, make a new column to create a calculated column.
To create a new column in Power BI:
- Click on the New column from the top right.
- Enter a Calculated formula in the formula bar.
For example, you have a Sales table with Quantity and Product_Price columns. To calculate Total Sales, the formula will be Total Sales = Sales[Quantity] * Sales[Product_Price], and you will get a new column.
It is hard to remember all the expressions, and to help with that, you can use the Quick Measure tool from the top ribbon in the Table view.
You must ensure you have made relationships between the tables. If the Power BI relationship is not working, the formula can return an error.
Generate a Visualization Report
You have made a data model, and now you can make a visual report in the Report View. There are various built-in visual types in Power BI.
To create a visualization report in Power BI:
- Go to the Report view.
- Select a Visual type from the Visualization pane.
- Choose the data from the Data pane you want to visualize.
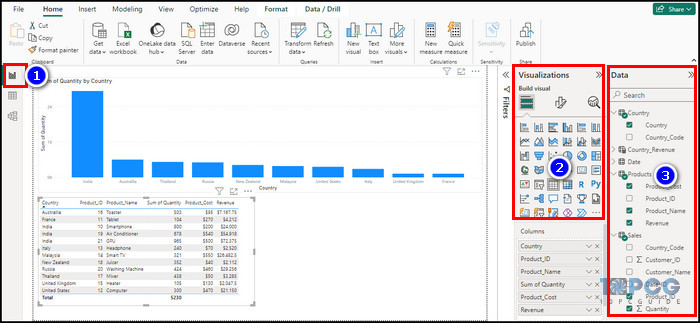
And, you will get an excellent report with visualization with your data modeling.
Recommended Optimization of a Power BI Model
Power BI auto detects the relationship between tables if there are common columns of multiple tables. If there is any wrong cardinality or cross-filter direction is set, the relationship will break, and you will get errors in the column’s value.
Here are the factors you should do to optimize a Power BI data model:
- Disable time intelligence: An additional table is created in the data model every time a date field is added in a visual. Power BI creates date/time hierarchies automatically for the time intelligence feature. Due to this, the report becomes bloated, and the refresh time is raised. I recommend turning off the feature.
- Load columns that you need: When you import data from an Excel file, it can import unnecessary columns that you don’t need in the report. You can remove the unnecessary columns from the Power Query editor.
- Remove unnecessary rows: With a large source data, you have a large amount of data to display in the visual report. However, some of them are less important, and if that is the case, you should delete the unwanted rows to display much historical data a viewer needs to see.
That being said, if the viewer wants to see older data, you can summarize a version with the old data and import that rather than every single data.
- Verify Cardinality and Cross filter direction: To get an accurate report, you must set proper cardinality and cross-filter direction. So, double-check the settings while making relationships. Edit the settings if required.
- Use Calculated columns and tables: With the DAX formula in the formula bar, you can create calculated Tables with custom columns. It is essential to get new data and display unique Power BI visuals that help decision-making.
- Make simple data model layout: If you have a complex data model, consider creating multiple small layouts for each table. For example, if the model has 5 different reports in 5 different tabs, cut it down into 5 different small layouts.
Final Thought
To monitor massive amounts of data and generate meaningful reports in a large organization, automated analytics tools like Power BI play a crucial role in decision-making. With data modeling, you have to make the foundation to build a visual report.
In this article, I have comprehensively discussed Power BI data modeling. If you have any further queries, please leave a comment.
Have a nice day!