Whether you’ve just started using Power BI or have been using it for a while, you might have heard the term DAX function. This keen feature is actually quite powerful and allows users to quickly perform a multitude of works, like generating new data from existing tables.
Similar to the functions in Excel, you need to have a deeper understanding of how to employ such formulas and where.
So, let’s dive into this article, as I have given a step-by-step tutorial on the Power BI DAX function.
What is DAX in Power BI?
DAX is actually an abbreviation of Data Analysis Expressions. It’s a formula expression language that can be used in Power BI to create new information from existing data models. These predefined formulas can also perform complex calculations and queries on data from any imported tables and columns.
A DAX formula is usually composed of functions, values, and operators that a user can define.
Furthermore, the parameters of the formulas can cover various categories of operations, such as arithmetic, text, date, logical, and aggregation.
Now, there are some prerequisites for using such a function in Power BI. For example, to use DAX in Power BI, you need to create measures or calculated columns in your data model.
Benefits of Using DAX in Microsoft Power BI
The DAX functions are like the hands of the Power BI service; using them can only increase the efficiency of your workflow.
From performing simple calculations to re-using values from a table and creating a whole new section, such formulas have their own importance.
For example, using DAX really comes in handy when you want to futureproof your report and avoid scrubbing through many relationships and formulas when you need to change certain values.
Additionally, when a report or a project requires you to perform complicated calculations that the simple AVERAGE or SUM can not handle, combining different DAX functions to employ a complex formula is the only way through.
In short, instead of manually finding or creating values, the DAX formula can take the load off of your shoulders and do the work for you with a few simple formulas.
How does DAX Work in Power BI?
A DAX formula works with 3 fundamental components, which dictate the functionality and the return value in MS Power BI.
These three base concepts are:
- Syntax – The various components that make up a formula are called Syntax. Some syntax can be the same in different formulas. These can either be the denotations that are used in a formula to indicate the rows, columns, or the signs/parameters.
- Functions – The predefined commands that are used in a DAX formula are called a function. These functions determine the execution type of the given formula.
- Context – When it comes to using DAX functions, the context determines the rows that will be scanned to get the desired return.
These contexts can be divided into two categories: Row Context and Filter Context.
A row context scans the current rows of all targeted columns, while a filter context determines the condition that is applied to the said rows.
Together, these inputs perform the user-defined execution and fetch the value from a dataset accordingly. That’s how the DAX feature works in PBI.
When and Where to Use DAX Functions
In general, there are three types of calculations/data analysis that can be done with the help of DAX formulas.
These are:
1. Calculated Columns
Users might need to add a calculated column to the data table based on various needs, like creating a column with the average value of the corresponding rows and such.
For those instances, these calculations are applicable and can be done with subsequent formulas.
2. Measures
If you need to add aggregations or extended summaries from certain values into a data table, these types of calculations can be done with subsequent DAX functions.
3. Calculated Tables
Sometimes, a simple column might not suffice for your project/report set. In that case, you might need to add a new table based on the calculations from existing datasets. Instead of manually adding the said table, you can use corresponding DAX calculation formulas to automate the creation.
Now, you might be wondering, where is the formula bar to type the functions in Power BI?
Well, when you begin to add a new measure, column, or table, a formula bar will appear just under the top ribbon where you can insert and use the aforementioned functions accordingly.
How to Use DAX Function in Power BI
As I have previously mentioned, the DAX function can be used in your Power BI project/work for either calculations or data analysis. Hence, the usage of this feature entirely depends on the users themselves.
That being said, among the three work cases I’ve described earlier, people mostly use the calculated columns and measures calculation. Nonetheless, below, I have described all three work processes in a step-by-step manner.
Here’s how you can use DAX in Power BI:
Create Measures with DAX in Power BI
Before you can do any aforementioned functions, you need to carefully create a data model that can work with the formulas. In order to successfully employ a DAX function, correctly arranged and sorted table sets are a must.
Otherwise, you’ll run into issues like the Power BI RELATED function not working or something like that.
Follow these steps to create your first measure in Power BI:
Step 1: Import Data and Create Model
Let’s load up our existing Excel data files and see what happens.
- Launch the Power BI application on your device and click on Import data from Excel. You can also import from other sources as well.
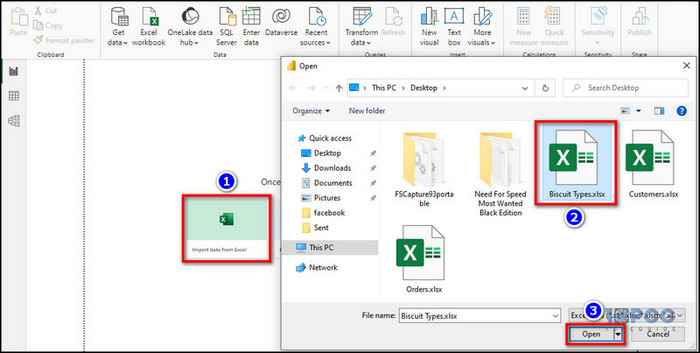
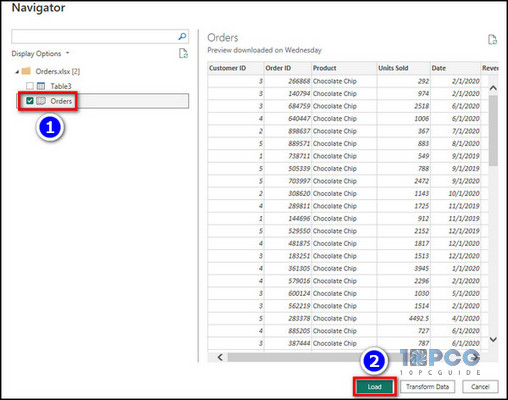
- Select the source table and hit Load. Repeat the process for all the data sets that you need to import.
- Click on the Table view icon from the left side pane and check if all the data models are loaded properly.
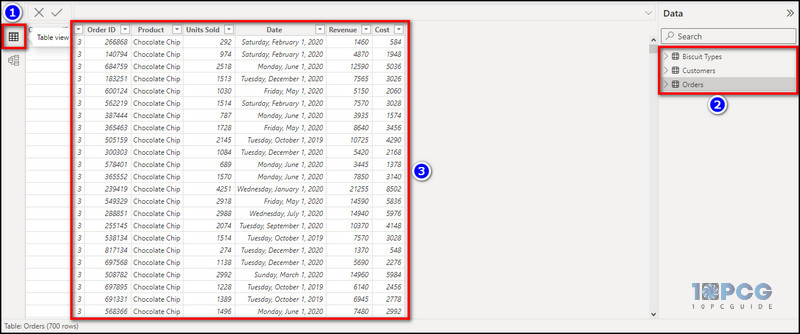
For demonstration, I have imported the sale-related data like Biscuit Types, Customer ID, and Order lists, which include all the necessary values perfectly sorted into columns and rows. Check the embedded image for reference.
Step 2: Add Relationship Between the Tables
Next up, define the relationships. From our data set in the Model view, we can see we have three distinct tables: Orders, Customers, and Biscuit Types.
In the Orders and Customers model, we have a common column named Customer ID. As we know, we can only create a relationship with the common denominator, so let’s create a one-to-many relationship from Customers to Orders.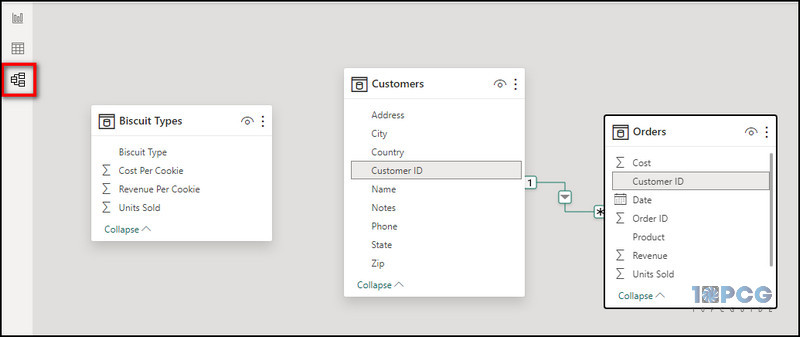
Now, let’s move the Orders table in between and establish a relationship between Biscuit Types and Orders. But wait, there’s no common column here! So what can we do?
Well, we can see that there’s a column named Biscuit Type in the Biscuit Types model, which is the same as the Product column in the Orders model.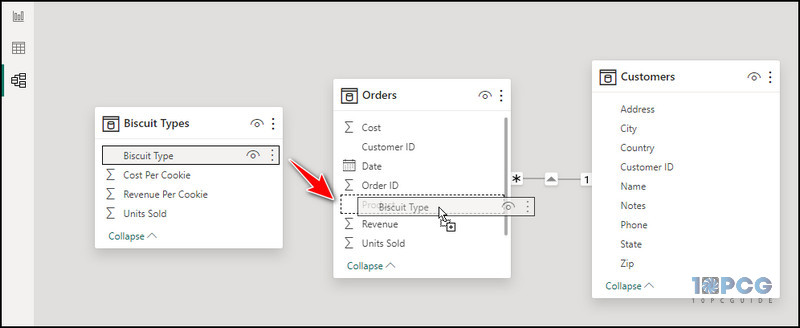
Hence, we can drag the Biscuit Type column and drop it on top of the Product column to create a one-to-many relationship between the two aforementioned tables.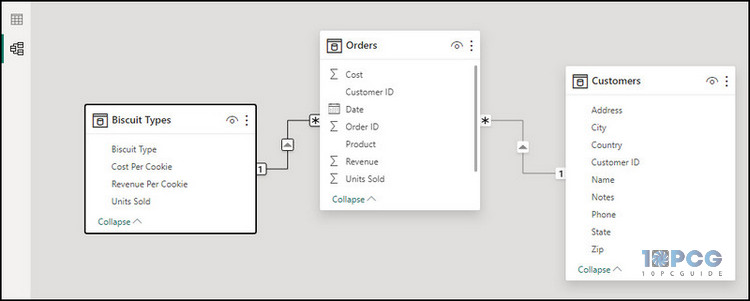
By the way, I feel obligated to say that there’s a reason why I put the Orders table in between. It’s because I’m going to use it as the report table and create the measure calculations on this.
Step 3: Deploy SUM Function to Create New Measure
Now, the real fun begins. If we quickly glance through the Orders table from the Table view tab, we can see all the different orders along with how much we sold for each order. Let’s say we want to sum up these values and check how many biscuits we managed to sell in total.
- Click on the Report view tab from the left side pane.
- Right-click on Orders from the Data section located on the right-hand side.
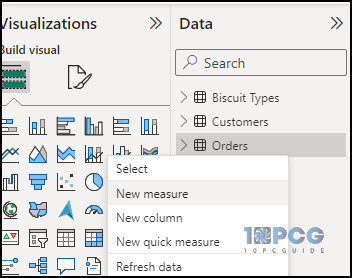
- Select New measure. It will bring up a new tab on the top ribbon and a formula bar where you’ll see MEASURE already written.
- Remove MEASURE from the formula box, and in its place, type Total Units Sold = SUM(.
We’ll see all the available parameters from all the table columns. Since we want to sum up the total sales from the Orders table, let’s scroll down, select Orders[Units Sold], and close the bracket.
Here, the Orders denote the table, and Units Sold denote the column, but more on that later. So, our final DAX formula stands as:
Total Units Sold = SUM(Orders[Units Sold])
Now, click on the tick icon new to the formula bar or hit Enter. That’s it! We’ve just created our measures column, which can be seen from the Data section within the Orders model.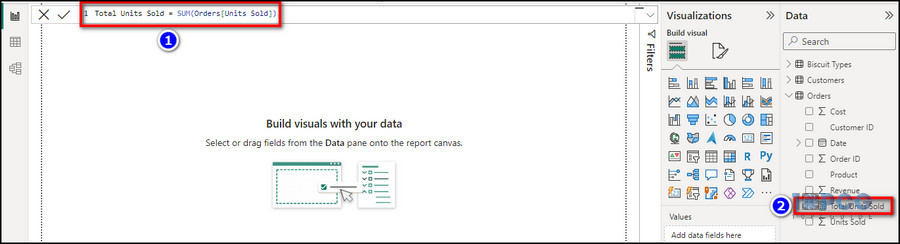
After that, you can tick the box for the newly added column and view it as a report, which can be changed from the Visualizations section.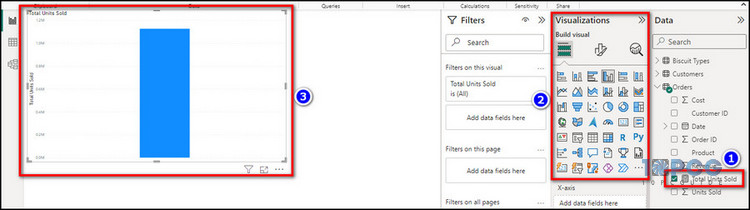
Create Calculated Columns with DAX in Power BI
That was a pretty basic tutorial, so let’s try something a bit more complicated. Say we want to find out how much profit we made for each order. For that, we have to create a calculated column for each row, which can easily be done with a simple DAX formula. Here’s how:
- Click on the Table view icon from the left side pane and select the Orders data model from the right side pane.
- Go to the Table Tools tab from the top ribbon and click on New column.
- Type Profit = in the formula bar and determine the parameters.
Now, since we want to see the profits, we have to subtract the cost from the revenue. Hence, type Orders[Revenue] – Orders[Cost], where the Orders[Revenue] denotes the Revenue column, and Orders[Cost] denotes the Cost column from the Orders table.
The minus(-) operator subtracts the values of each subsequently mentioned row and returns the value in the rows of the newly added column.
Anyway, the final DAX formula should look something like this:
Profit = Orders[Revenue] – Orders[Cost]
Now, press Enter on our keyboard, and voila! We’ve created a calculated column containing all the desired values.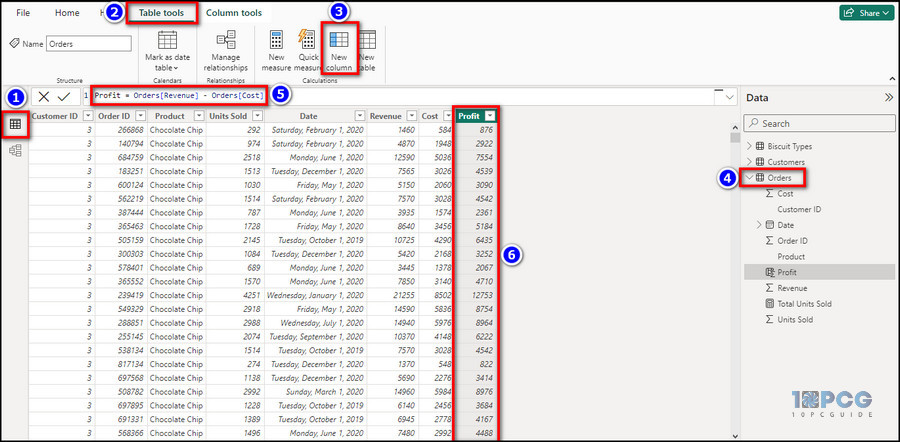
Similarly, we can create a calculated table from the Table Tools > New table option.
How to Write a DAX Function in MS Power BI
For a better understanding of the DAX formulas, we need to know how their building blocks work. When you can easily read each component/parameter of the function, only then can you properly deploy them within your Power BI work.
So, let’s see what each of the blocks within a DAX formula means from an example function. Here: 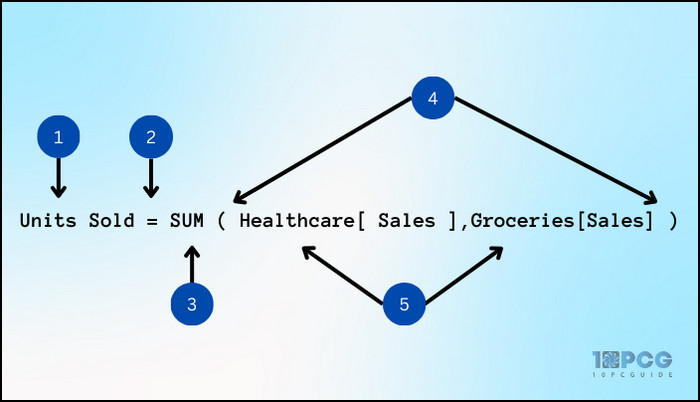
- The calculated table/column or the name of the targeted measure.
- The equal to(=) is an operator that denotes the beginning of the formula.
- The DAX function.
- The bracket indicates the parenthesis.
- The table where you want to run the formula to get the desired value.
- The targeted column within the table.
That being said, notice how a comma separates each component because that’s just how a formula needs to be written.
When we apply the Units Sold = SUM(Healthcare[Sales],Groceries[Sales]) formula, we’ll get the summation of the sales from the Healthcare table and sales from the Groceries table.
Now, if you need to relate the sales values of the groceries with the product names of healthcare, you can change the DAX function and parameters like this:
Healthcare[sales] = RELATED(Groceries[Sales])
That’s how you write a DAX formula and change some of the components according to your needs.
DAX Function Types
First of all, the DAX functions can be boiled down to 7 types, with each type containing different formulas.
These 7 types of DAX functions are:
- Parent-child functions — To manage and visualize data in a hierarchical order.
- Count — For counting rows that contain non-blank values in large columns.
- Date-Time — To calculate periods or dates within the data in a standard format.
- Mathematical — To perform calculations for trigonometric or mathematical queries.
- Logical — For logical operations and true/false returns.
- Information — To fetch desired values from the data tables.
- Text — For string-based operations from columns or tables.
As the name suggests, these function types have different applications based on the use case or available dataset.
DAX Functions List with Examples
There are many DAX functions in total, and each of them serves a different purpose. Let’s see what they are and how they can be used.
Here’s the list of DAX functions/syntax in Power BI:
| DAX Function | Syntax | Example |
| PATH | =PATH(<Child_ColumnName>,<Parent_CulumnName>) | This =PATH(Sales Rep[ID], Store[Address]) function lists all the identifiers from each column in a string value. |
| SUBSTITUTE | =SUBSTITUTE(<string>,<old_text>,<new_text>) | The =SUBSTITUTE([Product], “Soap”,”Shower Gel”) will replace the value Soap to Shower Gel in the Product string. |
| PATHLENGTH | =PATHLENGTH(<path>) | This =ATHLENGTH(PATH(Sales Rep[ID], Store[Address])) command will show the number of column parents in the given path. |
| DATESBETWEEN | =DATESBETWEEN(<Dates>, <StartDate>, <EndState>) | The =CALCULATE(SUM(Sales([Sales Amount]), DATESBETWEEN(Sales[Date], Date(2023,4,5), Date(2023,6,22))) command will sum up the sales numbers from columns that are between the specified dates. |
| DATEADD | =DATEADD(<Dates>, <Number_of_Intervals>, <Intervals>) | The =DATEADD(ProductInventory[InventoryDate],1,YEAR) formula will shift the year forward or backward with the given interval. |
| ENDOFYEAR | =ENDOFYEAR(<DATES>, [<Year_End_Date>]) | The =CALCULATE(SUM(Sales[Amount]),ENDOFYEAR(DateTime[DateKey])) command will sum up the sales revenue from last year according to your set parameters within the formula. |
| LASTDATE | =LASTDATE(<Dates>) | The =LASTDATE(Sales[Date]) formula will show the last date when the column was changed. This can indicate that a sale was made that day or something similar. |
| OR | =OR(<argument1>,<argument2>) | The =OR([Award Count]<69, [Count of Play]>45) command will show TRUE if one or both arguments are true. Otherwise, it will show FALSE. |
| AND | =AND(<argument1>, argument2) | The =AND([Country]=”UK”,[Award]=”Silver”) function will check if both arguments are true or false and return a result accordingly. |
| SWITCH | =SWITCH(<argument>, <value>, <result>, <value>, <result>, <value>, <result>, <value>, <result>….,[<Else>]) | The =SWITCH([Employee], 0, ”Emily”, 1, ”John”, 2, ”Sarah”, 3, ”Duke”, 4, ”Phill”, 5, ”Jim”, 6, ”Bond”, ”Unknown”) command will check the argument for each value and return the corresponding result if it’s true. |
| IF | =IF(<condition>, <first_value>, <second_value>) | The =IF([Village]=”Fortfox”,1,0) function will check the argument in our table. If it finds Fortfox in the Village column, it will show 1. Otherwise, it will return the value 0. |
| CURRENCY | =CURRENCY(<value>) | The =CURRENCY(3.6666) function will convert the data into a currency value, like 3.67$. |
| DATEDIFF | =DATEDIFF(<StartDate>,<EndDate>,<Interval>) | The =DATEDIFF(DATE(2023,3,1), DATE(2023,6,31), MONTH) function will show 3 as the return value. |
| CALENDAR | =CALENDAR(<StartDate>,<EndDate>) | The =COUNTDAYS(CALENDAR(DATE(2023,3,2), DATE(203,5,6))) function will give you 65 as the result. |
| DATEVALUE | =DATEVALUE(<DateText>) | The =DATEVALUE(“11-4-2023”) formula will convert the given date into a date-time format, like 11/4/2023 10:35:45 PM. |
| NOW | =NOW() | =HOUR(NOW()) formula will show you the current system time in a standard format, like 10:35:45 PM. |
| CONCATENATE | =CONCATENATE(<string1>,<string2>) | The =CONCATENATE(“Big”,” PP”) will combine two strings into one and show Big PP. |
| GEOMEAN | =GEOMEAN(<column_name>) | To check the geometric mean of your Sales column, type the =GEOMEAN(Sales[Sales_Amount]) function. |
| FIND | =FIND(<find_text>, <within_text>, [<StartingValue>], [DefaultValue]) | The =FIND(“Tutorial”, [Base], 5, BLANK()) command will search for the Tutorial in the Base column and show the position of its first occurrence. |
| EXACT | =EXACT(<string1>,<string2>) | When you type the =EXACT(Results[Sport],[Sport]) formula, the EXACT function will compare the two given strings and show True or False based on whether they have the same values or not. |
| PATHCONTAINS | =PATHCONTAINS(<Path>,<Item>) | The =PATHCONAINS(“Store | Batch | Unit | Shipment”, “Health Care”) formula will show True if it finds Health Care in the listed paths. Or else it will return False. |
| ABS | =ABS(<number>) | The =ABS(-10) formula will remove the sign from the given number and show its absolute value. Meaning it will return 10. |
| LOG10 | =LOG10(<Value>) | The =LOG10(25) formula will return the logarithmic value in base 10, which in this case is 1.3979. |
| SQRT | =SQRT(<number>) | The =SQRT(144) will square root the given value and show the answer, which is 12. |
| CONFIDENCE.NORM | =CONFIDENCE.NORM(alpha, deviation, size) | The =CONFIDENCE.NORM(0.09, 3.9, 69) will show the confidence interval of the given sample, which is 1.1446. |
| BETA.DIST | =BETA.DIST(x, Alpha, Beta, Cumulative, [P,[Q]]) In this function, x indicates the value between the upper bound Q and the lower bound P, and the distribution parameters are defined by the Alpha & Beta. Also, the form of the formula is determined by the Cumulative. | The =BETA.DIST(1,3,7,8), TRUE(), 0,1) command will give you 0.999 as the result. |
These are some of the important DAX functions in Power BI. You can bookmark this web page and use this list as a Power BI DAX cheat sheet.
Top 10 DAX Functions in Microsoft Power BI
If you don’t want to go through so many functions and only want to know the best ones, I’ve got your back.
Here are the top 10 DAX functions that you should definitely know about:
| DAX Function | Syntax |
| CALCULATE | =CALCULATE(<expression>,<filter1>,<filter2>,…) |
| SUMX | =SUMX(<table>,<expression>) |
| AVERAGE | =AVERAGE(<column>) |
| MIN/MAX | =MIN(<column>) or MAX(<column>) |
| RANKX | =RANKX(<table>,<expression>[,<value>[,<order>[,<ties>]]]) |
| CONCATENATE | =CONCATENATE(<string1>,<string2>) |
| SWITCH | =SWITCH(<expression>,<value1>,<result1>[,<value2>,<result2>]…[,<else>]) |
| ALL | ALL([<table>[,<column>[,<column>]…]]) |
| FILTER | FILTER(<table>,<filter_expression>) |
| RELATED | RELATED(<column>) |
For both personal and business analytical workloads, these are the formulas that are mostly sought after.
Conclusion
After all things said and done, knowing how to chart your data and when or where a DAX function should be applied is one of the main lessons to learn on this current topic.
Nonetheless, this Power BI DAX tutorial for beginners should give you an overview of everything you need to know about this feature.
In case you get stuck with other MS PBI-related issues, don’t worry; we’ve got your back. Feel free to check out our website for further assistance.