Sometimes, words aren’t enough to convey a perspective that’s driven entirely by data. Sometimes, a graphical demonstration goes a long way to get your message across the room. And as a leading productivity suite, Microsoft Office tools, such as Word, allow you to do just that.
Whether you’re trying to insert a graph that you made on paper or to create a graph from an existing Excel sheet, I’m here to help.
Enough chitchat; let’s get started.
How to Insert a Graph in Microsoft Word
To make a bar or line graph in Microsoft Word, click where you want to add the graph and select Insert > Chart from the top ribbon. Now, click on Line, Bar, or other graph types from the left side pane and choose the graph style from the top options. Then, hit OK to insert the graph.
Before we discuss it any further, let’s get the most basic out of the way: what is a graph in Microsoft Word?
A graph illustrates the relationship between different data and values. It’s basically a pictorial representation of information for better understanding. There are different types of graphs, like Line, Bar, Pie, Column, and more, with each having different styles as well.
All these graph types are present in the Word app and can be added to your document without much effort.
Here’s how to make a graph in Microsoft Word:
- Click where you want to make a graph in your Word document.
- Select Insert > Chart.
- Choose the graph type (i.e. Line, Bar, Pie, etc.) from the left pane.
- Select the graph style from the upper section.
- Hit OK.
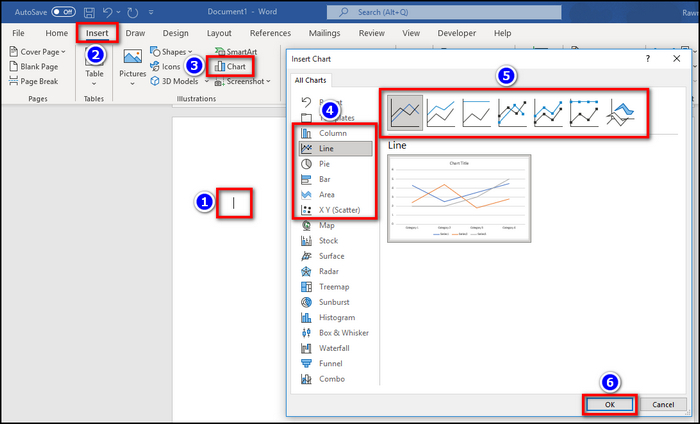
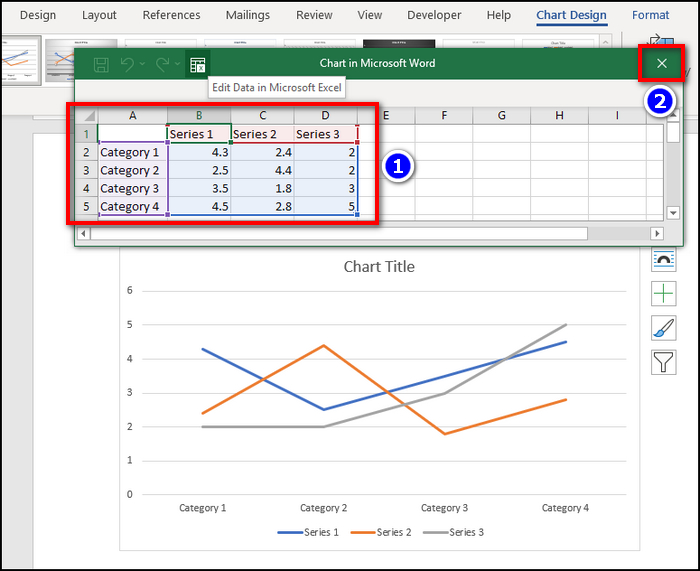
- Insert the graph data into the spreadsheet that appears.
- Click on the X (close button) when you’re finished.
Done! In case you’re wondering how to make a graph in Word online, just follow these same steps. Furthermore, you can even import existing data from your Excel sheets to the newly created graph. That brings us to our next topic.
On a side note, check out how to insert a blank page in MS Word.
How to Draw a Graph in Word Using Excel
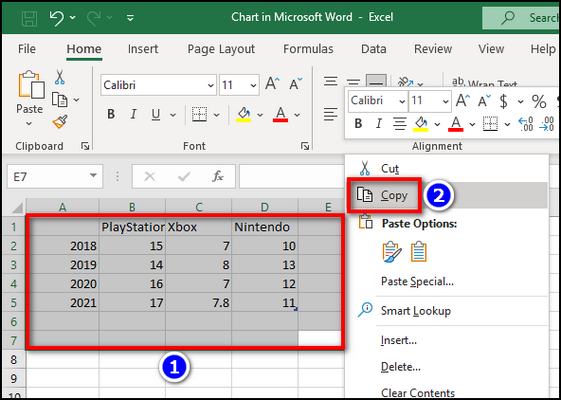
To draw a graph in Word using Excel, open the existing spreadsheet & highlight the entire chart. Now, press Ctrl+C and go to the Word document. Select Insert > Charts, choose the chart type/style & click OK. When a spreadsheet appears, highlight the default values & press Ctrl+V.
Before pasting your chart, make sure you’ve selected the correct type of graph that can accurately represent the values from your sheet. If you see a warning message while pasting, hit Yes. Below, I have thoroughly discussed this technique for better comprehension.
Here’s how to add a graph in Word using Excel:
- Go to your existing Excel sheet and select the entire chart.
- Press Ctrl+C together on your keyboard.
- Open the Word document and click where you want to add your graph.
- Navigate to Insert > Charts and select the graph type.
- Click OK.
- Select all the default values from the pop-up Excel sheet and press Ctrl+V.
- Click on Yes if a message appears.
This method is quite useful when you regularly change the data on your spreadsheet & want that latest change to appear on your Word graph. Just make sure to link the original Excel sheet when you’re pasting the chart.
Just in case, check out what to do when you’re having issues with copy-pasting in Microsoft Word.
How to Insert a Graph in Microsoft Word on a Phone
If you want to make a graph in Word on an iPhone or iPad, download both the Microsoft Excel and Microsoft Word app from the AppStore. Now, create your graph from the Excel app and copy it. Then, open Word and paste the graph into your document. The same goes for Android.
Too brief? Have no worries. Just follow the below-listed method, and you’ll be able to make your own Word graph on your smartphone in no time.
Follow these steps to create a graph in Word on iPhone/Android:
- Go to the Google PlayStore (for Android devices) or AppStore (for iOS devices).
- Download & install Microsoft Excel and Microsoft Word on your device.
- Launch Microsoft Excel and sign in to your Microsoft account.
- Go to your workbook and choose your existing graph or chart.
- Tap anywhere on the graph/chart and select Copy.
- Run the Microsoft Word app and open your document.
- Tap and long press where you want to insert your graph.
- Select Paste.
Now, you might need to adjust the layout and format of the graph to show all the data properly within the screen. If you’re having trouble pasting content in MS Word, check out the embedded article.
How to Change the Graph Format & Data in Word
After you’ve added the graph and its corresponding data to your Word document, you’ll need to do some additional tinkering to finish up the process. This includes formatting the data, adjusting the layout, modifying the graph elements, etc.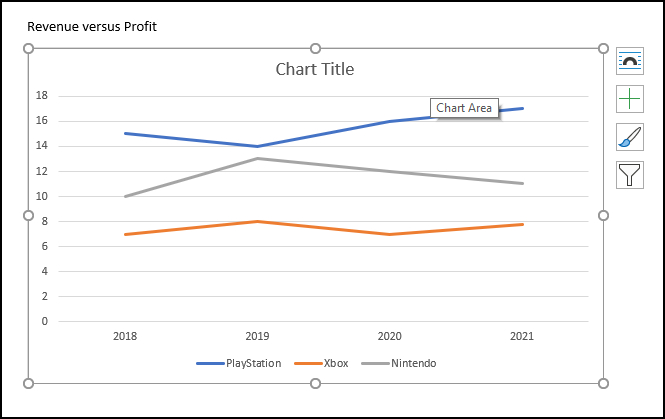
These options can be found on the right-hand side of the graph when you hover your cursor over the chart or click on it. Here’s what those buttons do:
- The Layout Options allow users to adjust the interaction & position of the graph among the texts in their documents.
- The Chart Elements option is to customize the graph’s title, legends, bar lines, etc.
- The Chart Style option is for changing the preset style and color scheme of your graph.
- The Chart Filter lets us show or hide specific data entries of the graph.
Furthermore, you can right-click on the chart and select Edit Data to change the source values of your graph.
Frequently Asked Questions
Can you make a graph from a table in Word?
Yes, you can make a graph from a table in MS Word 2016 or newer. To do so, highlight the table and click on the Insert tab. Now, click on Object from the Text section and choose Microsoft Graph Chart. Then, select OK and your table will turn into a graph.
Is there a graph template in Word?
Yes. There are graph templates in the Word app. Additionally, you can save your custom graph as a template or even add any downloaded charts to the template folder.
How do you make an XY graph in Word?
To make an X Y graph in Word, click on Insert > Charts and select XY(Scatter) from the left pane. Then, select the graph style and click on OK. After that, an Excel sheet will open up where you can replace the default value with your own graph data.
Ending Remarks
In short, whether you want to add a bar graph or a line graph in Word, simply navigate to the Insert tab and select Charts from the Illustrations section. There, you’ll find all the options to make and customize any sort of graph based on your needs.
I hope this article has provided you with all the information you were looking for. If you want further assistance, check out our other guides on Microsoft Productivity Suites.
Adios!