Statistical analysis is becoming more and more popular with each passing day. With increasing value in data, more people are jumping on board to learn basic statistics and data analysis.
You can analyze data in Excel, and finding p-value is something you can easily do in Excel. Learning how to do it should get you started on basic hypothesis testing.
 As someone who has worked with Excel for years, I want to help people start with the application as quickly as possible. So if you’re going to learn how to find the p-value in Excel, do not worry. I have got you covered.
So, read this article until the end to learn how to find the p-value in Excel.
What is P-Value in Excel?
The p-value is a figure that, when determined from a statistical test, indicates how likely you would have discovered a specific collection of observations if the null hypothesis were correct. You are more likely to reject the null hypothesis, the smaller the p-value.
This section will give you a brief idea of the statistical and mathematical concepts present in the p-value. So skip to the next section if something like that is not of interest to you.
You may have guessed by now that p-values are utilized in hypothesis testing to determine whether to reject the null hypothesis. You may not know its statistical idea if you are introduced to all this for the first time while working on Excel.
So to get started, what is hypothesis testing? A statistical process known as hypothesis testing analyzes data from a sample to make inferences about a population parameter or population probability distribution.
First, a hazy assumption about the parameter or distribution is made. The null hypothesis is what we refer to as this assumption.
The null hypothesis is included in all statistical tests. The null hypothesis for most tests is that there is no association between your variables of interest or no difference between groups.
A valuable foundation for making conclusions in hypothesis-testing applications is the idea of the p-value.
You can determine how likely your data will have occurred under the null hypothesis by looking at the p-value or probability value. This is accomplished by estimating the probability of your test statistic, which is the figure obtained from a statistical analysis of your data.
The p-value indicates how frequently you might expect to see a test statistic that is equally extreme or more extreme than the one determined by your statistical test if the test’s null hypothesis were true. As the test statistic derived from your data deviates more from the distribution of test statistics anticipated by the null hypothesis, the p-value decreases.
The p-value is sometimes called the observed level of significance for the test. It is a proportion. Assuming the null hypothesis is true, you would see a test statistic at least as extreme as the one you saw 10% of the time if your p-value was 0.1.
Related contents you should read about how to swap columns in Excel?
How to Calculate P-Value Manually?
The area under the probability distribution curve for all statistical values that deviate from the reference value by at least as much as the observed value, relative to the overall area under the probability distribution curve, is mathematically used to calculate the p-value.
You will need knowledge of integral calculus to understand this.
You can calculate p-values using Excel, R, Python, etc. You can find functions there that will help you out. A library may need to be installed on your computer to get the necessary function, depending on what kind of program you are using.
You can also get estimation tables for the p-value of your test statistic online. You can also find tables with certain parameters in books.
Based on the test statistic and degrees of freedom (number of observations minus number of independent variables) of your test, these tables show how frequently you would expect to see each test statistic under the null hypothesis.
The statistical test you use to evaluate your hypothesis will determine how to calculate the p-value. Different statistical tests produce different test statistics and use different assumptions.
The statistical test that best suits your data and the impact or relationship you want to investigate should be your selection. The size of the test statistic required to produce a certain p-value depends on the number of independent variables that you test.
The method used to calculate a p-value depends on the kind of test that you want to run. The three test types—lower-tailed, upper-tailed, or two-sided—describe the position on the probability distribution curve.
What Excel Function can be used to find the P-Value?
You can utilize one function that is part of Excel’s base program to aid in calculating a p-value. You can apply this function using the following formula:
| =T.TEST(a1,a2,tails,type) |
Here, T.TEST is the function. There are four arguments associated with the function. The a1 argument should be any cell range. The function argument a2 should contain the second data set(a range of cells). The number of distribution tails will be in place of the tails argument.
Finally, the type argument represents the statistical test you want to apply to the specified cell ranges.
In place of the tails argument, you can use numeric values 1 or 2 to indicate that you want to perform a one-tailed or two-tailed test, respectively.
The potential of a one-direction association is tested using a one-tailed T-test. However, directional relationships in other directions are not taken into account.
You will use a two-tailed test when you want to test your hypothesis in both directions.
There are different types of p-value analysis you can select in Excel. You decide which one to use by using the types argument appropriately.
The type argument can have three possible values. A paired test is performed if type equals 1. A two-sample equal variance test is performed if type equals 2. If type equals 3, a two-sample unequal variance test is performed.
You can estimate the means of both data samples using the two-sample equal variance type of p-value test on the presumption that their variances are roughly similar.
You can evaluate the means of both data samples using a p-value test known as the two-sample unequal variance test under the presumption that the variances of the two data samples are different.
You can measure the means of two associated data sets using a p-value test known as the paired test.
Here are some remarks about the T.TEST function that Microsoft considers important:
- When type = 1 (paired) and array1 and array2 contain differing numbers of data points, T.TEST returns the #N/A error value.
- Shortened to integers are the tails and type arguments.
- The #VALUE! error value is returned by T.TEST if tails or type are not numeric.
- The #NUM! error value is returned by T.TEST if tails have a value other than 1 or 2.
- TEST computes a non-negative t-statistic from the data in arrays 1 and 2. If tails = 1, T.TEST returns the likelihood that the t-statistic will have a higher value, assuming that array1 and array2 are samples from populations with the same mean. The number provided by T.TEST when tails = 2 is double that of tails = 1 and reflects the likelihood that the t-absolute statistic’s value will be higher under the assumption that the population means are the same.
Follow our guide to know how to Indent in Excel?
How to Find P-Value in Excel?
You can find the p-value in Excel in more than one way. You can use the T.TEST function. You can also use the Analysis Toolpack. Using the built-in function may seem more efficient, while the analysis tool pack will offer you more control.
1. Use the T.TEST Function
I have already discussed the T.Test function used to find the p-value in Excel. Now I will show you how to use that function to find the p-value in Excel.
Follow these steps to find the p-value in Excel using the T.Test function:
- Create an Excel spreadsheet and enter your data samples.
- Identify the type of t-test you wish to run and the number of tails.
- Use the formula =T.TEST (array 1, array 2, tails, type). Replace the arguments used in the function with appropriate replacements.
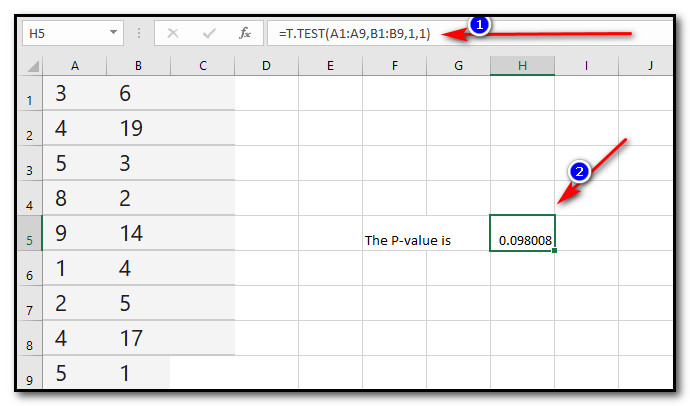
To illustrate how this works, I have used the sample data provided by the Microsoft official website to show how the T.TEST function works. This is an efficient way to find the p-value in Excel.
2. Use the Analysis Toolpak
To use the analysis toolpak, first, you must add it to your Excel.
Follow these steps to add the Analysis toolpak to Excel:
- Open the MS Excel program.
- Navigate to the File tab.

- Go to More > Options on the menu.

- Click on the Add-ins tab.
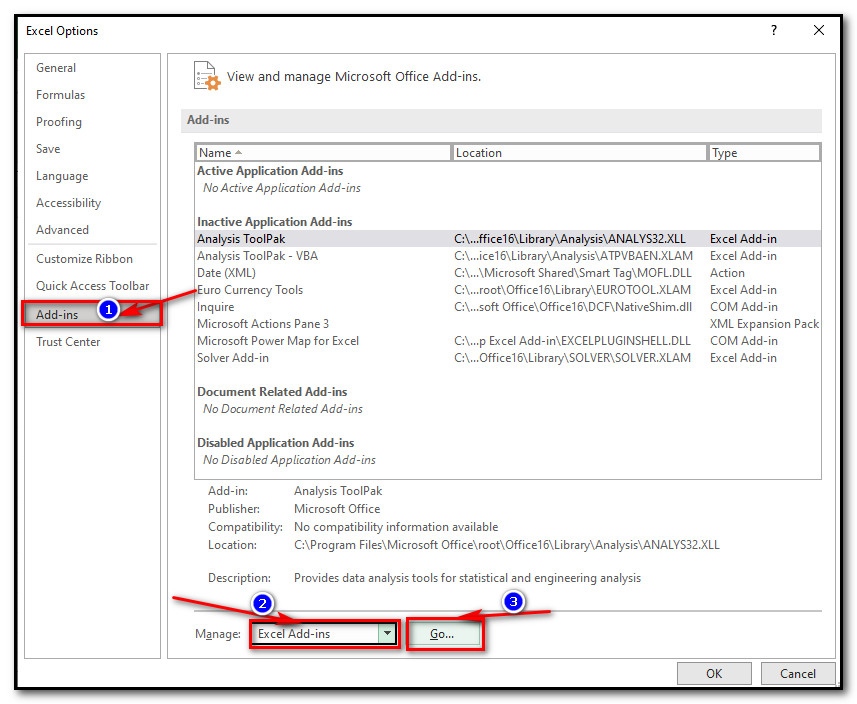
- Choose the Manage checkbox and click the Excel Add-ins Select Go afterward.
- Check Analysis ToolPak and then click OK to finish.
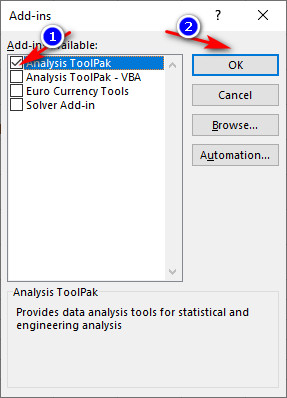
The Analysis ToolPak should now be usable.
Follow these steps to use the Analysis Toolpak to find the p-value in Excel:
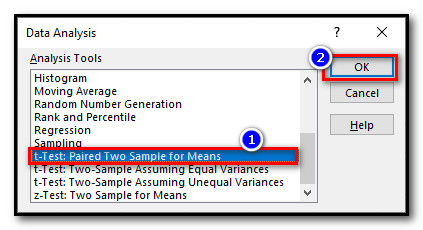
- Click on the Data tab in MS Excel. Select the Data Analysis option afterward.

- Select the Analysis Tools dialog box’s t-Test: Paired Two Sample for Means option.
- Select OK.
- Choose the first data range option to pick the first data set.
- Choose the second data range option to pick the second data set.
- Enable the Labels checkbox.
- Choose the spreadsheet cells you wish to see as your output by checking and selecting the Output Range before doing so.
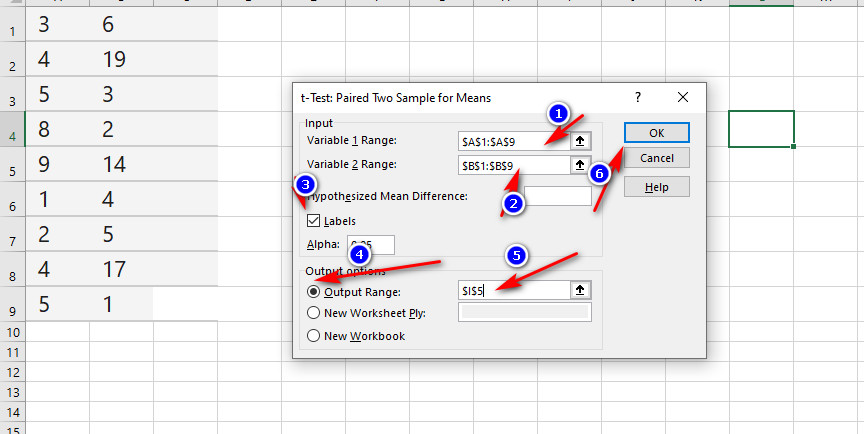
- Click OK to finish.
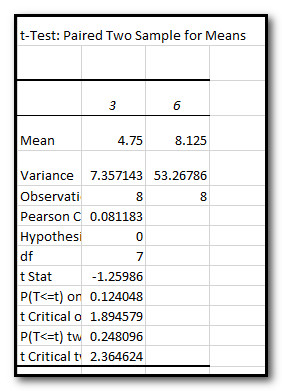
Once you finish, you should be able to see a nice tabular output displaying different results from a T-test.
Also, check out our separate post on how to lock a cell in a formula in Excel?
Conclusion
If you have read this far, you should now be able to find the p-value in Excel without any trouble. Additionally, you should now have somewhat of an idea about p-value and other related terms in hypothesis testing.
You can use the T.TEST function or the Analysis ToolPak to find the p-value in Excel.
Data analysis is a valuable skill set to acquire. You can get help from online courses or read a book. Excel happens to be a powerful tool for data analysis. So, you can keep an eye on our articles to get the help you need.
Last but not least, if you have any queries, comment below!