Finding how the variables are related to each other in a dataset is one of the most common statistical calculations, and Excel is a powerful tool to perform data analysis correlation quickly.
Correlation is often used in statistics or economics to find variations between multiple data.
In this article, you will learn what correlation is and how easily you can perform Excel data analysis correlation.
Let’s dive in.
Download The Practice Book »What is the Correlation Coefficient in Excel?
The correlation coefficient provides a variation value (between -1 and +1) between data sets. Correlation analysis tells you how closely related two data series are and offers insights into the strength and direction of the relationship between variables.
For example, there are ten people in a group. A datasheet contains the weight and height of those people. The value from calculating the correlation coefficient in Excel shows the interrelation between the values.
If the correlation value is below zero, it means a negative correlation. So, when the height rises, the weight goes downward, or vice-versa.
The positive correlation happens when the correlation coefficient value is more than zero. The weight will increase with the increments in height and decrease with the height value’s declination.
A correlation coefficient of +1 or -1 indicates that the variables change at the same rate. The correlation analysis results between +1 and -1 indicate that variables don’t change at identical rates.
The value 0 of the correlation coefficient tells that the variables do not affect each other.
Correlation analysis will help a company to make a sound strategic decision. Hence, it is essential to learn how to do it.
How to Calculate Data Analysis Correlation Coefficient in Excel
To perform data analysis correlation in Excel, you must enable data analysis from the Excel add-ins > select correlation from the data analysis window and set input & output range to get the value. You can also use the Excel correlation formula to evaluate the correlation coefficient.
Here are the methods to calculate Data Analysis Correlation in Excel:
1. Calculate Correlation Using CORREL Formula
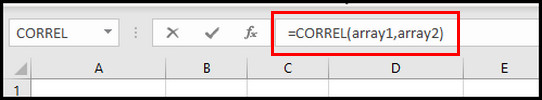
You can use the CORREL function in Microsoft Excel to compute the correlation value. This statistics function is helpful when there are only two data sets. You will require at least Excel 2007 to get the correlation value with the CORREL formula.
Suppose you have 3 data sets as below with height and weight values. You want to find the correlation of each data set and their relationship.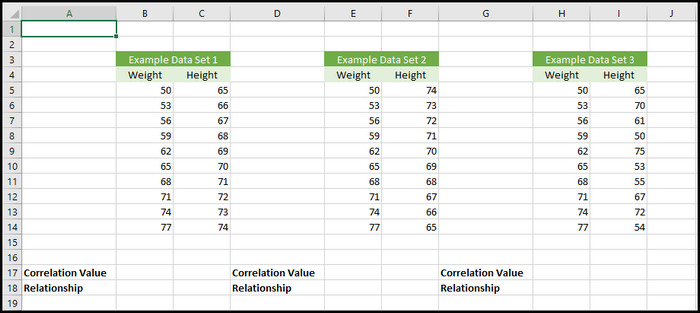
Follow the process below to calculate correlation using CORREL Formula:
- Select the Cell you want to get the correlation value.
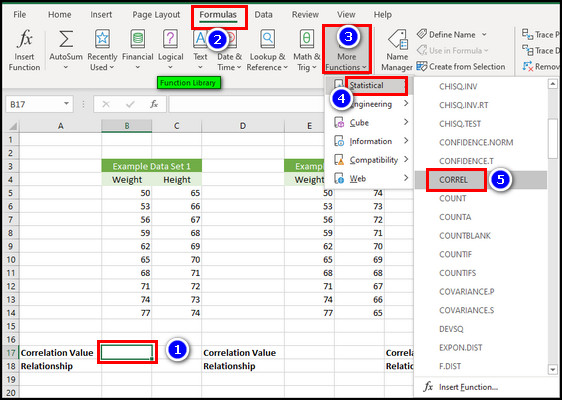
- Go to the Formulas tab in Excel.
- Expand More Functions from the Function Library group.
- Hover the cursor on the Statistical, scroll down, and select CORREL.
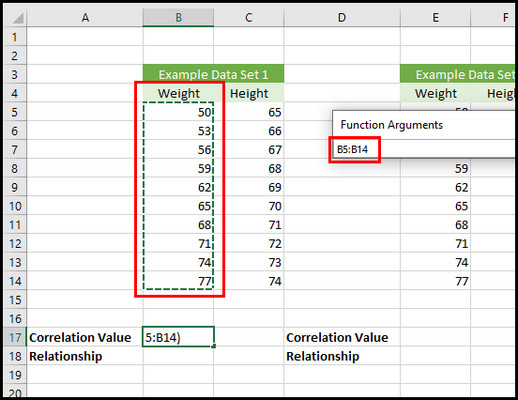
- Click on the up-arrow icon in the Array1 section.
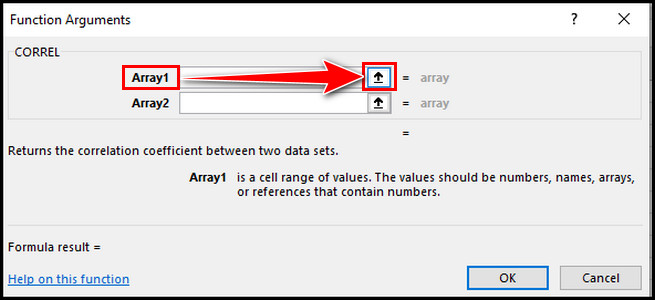
- Select the weight cell values and hit enter. In my case, it is B5 to B14.
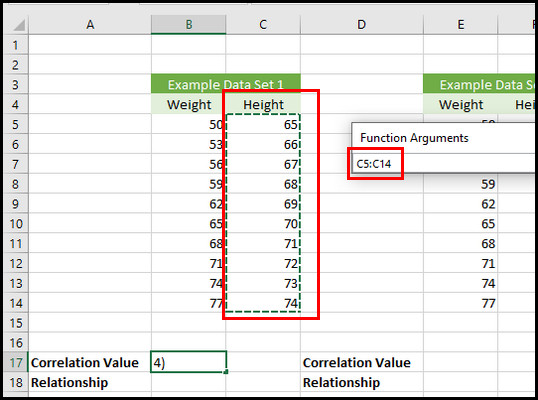
- Choose the height cell values for the array2 and press enter. It is C5 to C14 in my case.
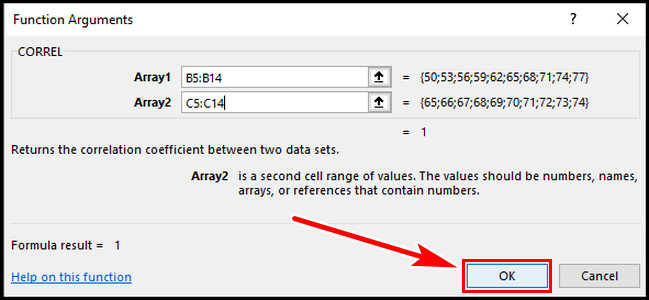
- Hit OK, and you will get the correlation value.
You will see, for our Example data set, the correlation value is +1. It indicates that when the weight increases, the height also increases. So, it’s a positive correlation.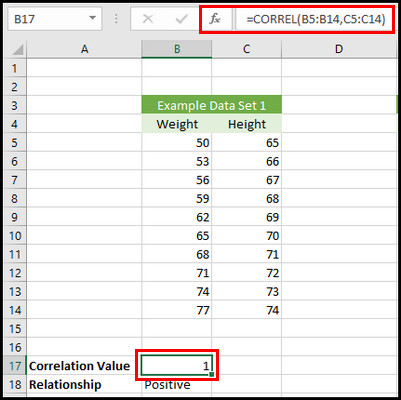
For the Example Data Set 2 and 3, the correlation value is -1 and -0.1284, respectively.
The -1 correlation for Example Data Set 2 indicates a negative correlation. The 3rd data set’s value is nearly 0, which means there is no relationship between height and weight, and the variation changes are random.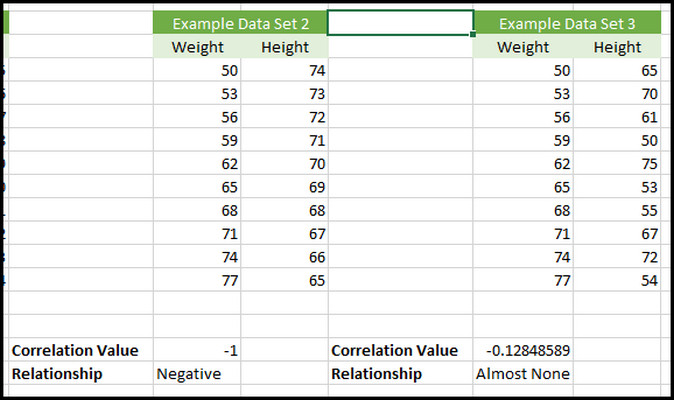
However, for multiple data series, you must use data analysis correlation. Keep reading to learn the process.
2. Use Data Analysis ToolPak to Calculate the Correlation
When you have more than two data sets, you must use Excel’s built-in Data Analysis ToolPak to calculate the correlation. However, the feature is disabled in Excel by default, so you must enable it before proceeding to the calculation.
Here are the steps to calculate the correlation using Data Analysis ToolPak:
- Go to the File tab and select Options in Excel. If you don’t see Options, click More, and you will find it.

- Select Add-ins.
- Choose Excel add-ins in the Manage drop-down and hit Go.
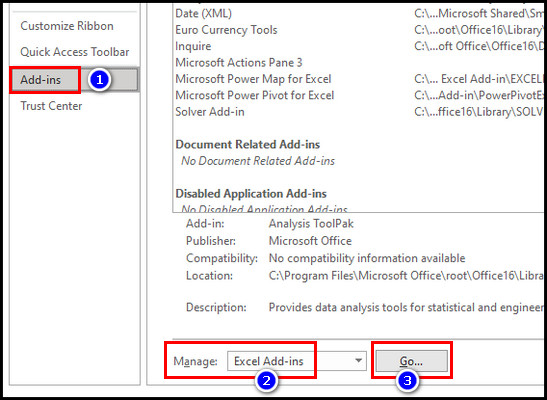
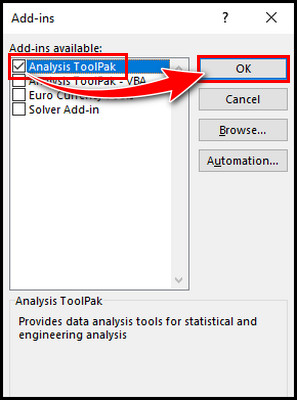
- Tick Analysis ToolPak and hit OK.
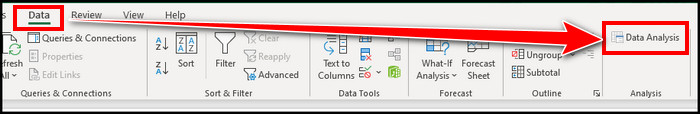
- Go to the Data tab and click Data Analysis from the top right.
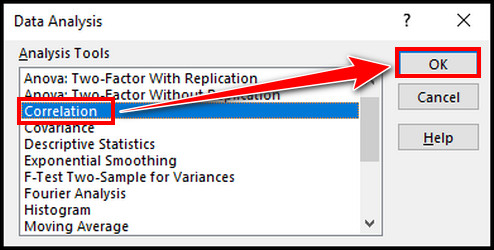
- Choose Correlation and hit OK.
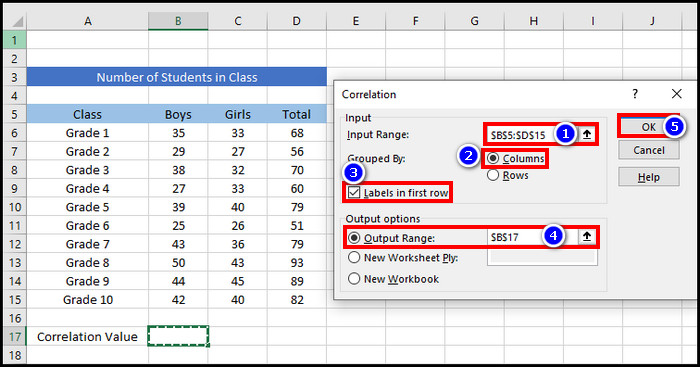
- Select the data in the Input range box.
- Tick box Labels in First Row.
- Select Output Range and choose a cell to get the value on the same worksheet. You can also opt to get the result in a new worksheet or workbook.
- Hit OK.
You will find a new table showing the correlation coefficient for the data. Note that the output table is static and won’t update itself if there is any modification in the original data points. In that case, you have to repeat the steps.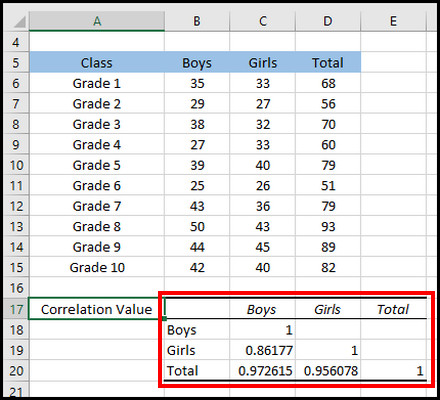
You can also calculate correlation by applying the Pearson function. It is similar to the CORREL formula. You must select a blank cell, type =PEARSON(array1,array2) in the formula bar, and hit enter to get the correlation.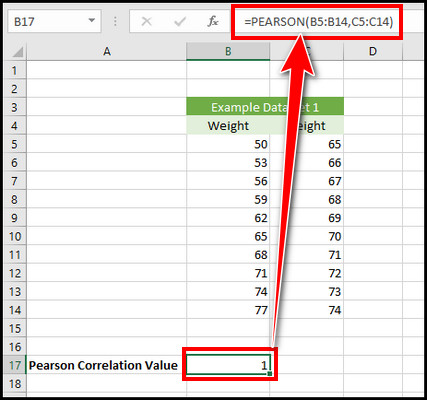
How to Plot Correlation Graph in Excel
You can plot the correlation in Excel to get the correlation graph for better understanding. You have to draw a scatter plot with a trendline to get a better visual representation of the correlation.
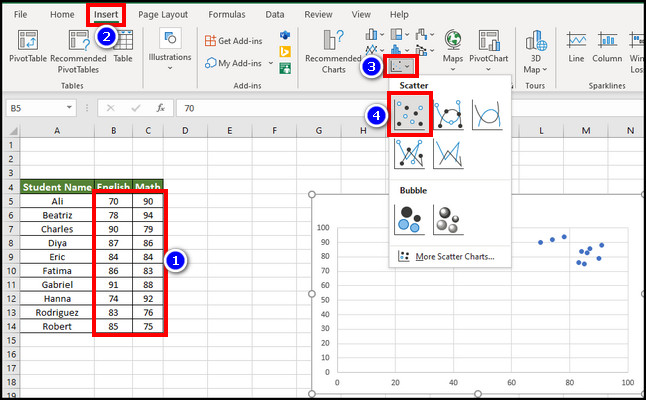
Suppose some students have English and Math numbers in a data sheet as below. I will show you the process of plotting the correlation graph.
To plot the correlation graph in Excel:
- Select the cell from B4 to C14.
- Go to the Insert tab.
- Expand Insert Scatter and Bubble Plots and click Scatter(1st one).
- Click on the Plus icon on the right side of the chart and tick Trendline.
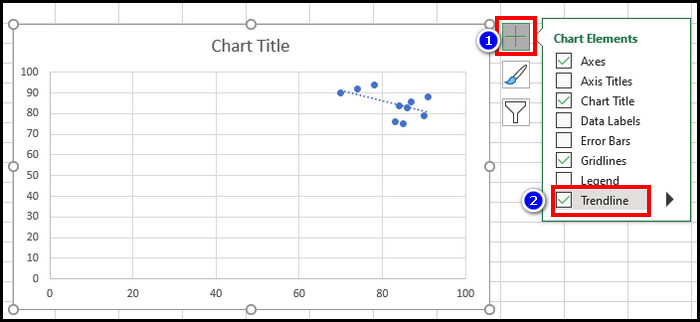
It will display the correlation graph in Excel.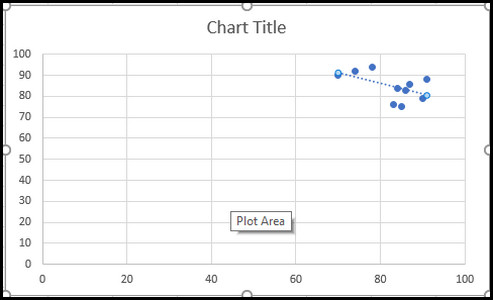
What is the Excel Correlation Matrix?
The correlation result you get after using Data Analysis ToolPak is also known as the Excel correlation matrix.
It can be hard to understand the output result for the first time. I will explain with an example data sheet shown below, so you can interpret the correlation result in your case.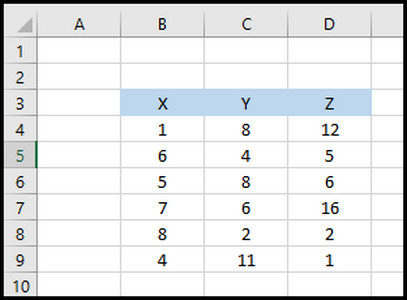
So, for this data, the correlation matrix will be as below: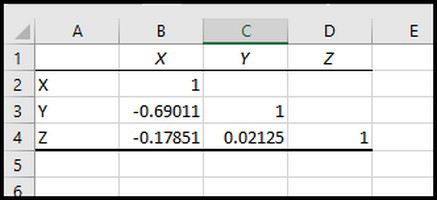
The Cell C4 indicates the correlation between Y and Z. The value 0.02125 tends to be zero, or you can say, a weak value. Cell B4 is the correlation between B and C and has a stronger negative value of -0.17851.
However, the strongest correlation is the B3 Cell at -0.69011.
To get a more straightforward concept, suppose X represents the visitor and Y & Z are marketing products. X and Y have a strong negative correlation value from the correlation matrix. Means Y has overall decreased engagement as a marketing product than Z.
So, companies can adjust the necessary changes by analyzing and interpreting the correlation matrix to get more profit.
Final Thought
Finding data analysis correlation in Excel is a solid starting point for marketing and sales development.
However, as the data analysis built-in feature is turned off in Excel by default, users can get confused. But, after reading this article, there should be no worries.
Have a nice day!