While evaluating the potential profitability of investment projects, the profitability index is the best tool for profitability investors.
It is a financial metric that represents the ratio of the present value of future cash and initial investment. Throughout this article, I will cover everything about the profitability index and share two projects with real-life examples.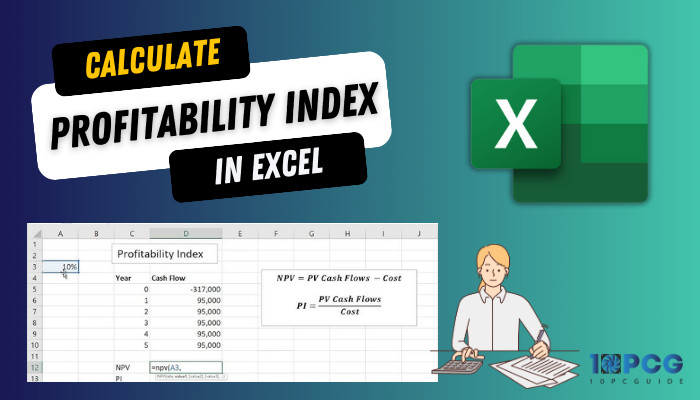
Without further ado, let’s get started!
A Brief Introduction of Profitability Index Formula
The Profitability Index (PI) is a unique measure that calculates the ratio between the present value of cash inflows and outflows. This formula helps identify the relationship between the expenses and benefits of a future project.
Primarily, inverters use this formula to predict future cash flows and determine whether the initial investment was a good or bad decision.
General Syntax of Profitability Index Formula
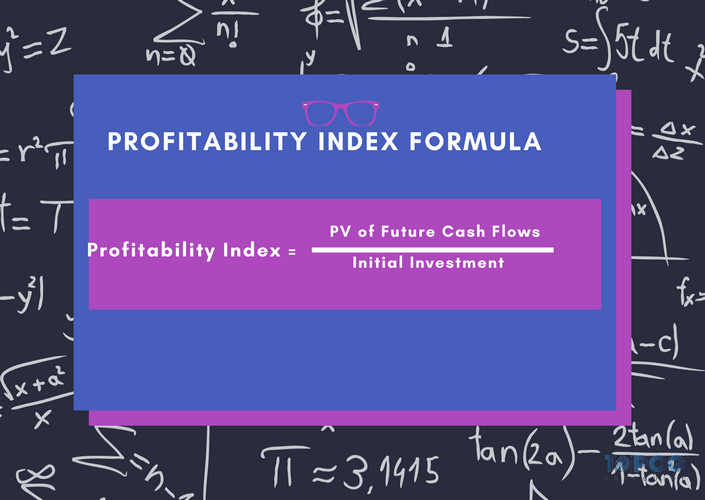
Following is the general formula for calculating the profitability index. Here, PV is the Present Value.
Move down to the next section to better understand the structure and functionality of the profitability index formula.
Explanation of Profitability Index Formula
Let me break down the formula so you can easily perceive what’s happening. If you closely inspect the formula, you will find two primary values: Present Value of Future Cash Flows and Initial Investment.
Here, the Present Value of Future Cash Flows is the sum of the present values of all possible cash inflows.
On the other hand, the Initial Investment is the total possible cost of the project.
Moreover, there is another version of this formula. Instead of the Present Value of Future Cash Flows, you can add the Net Present Value (NPV) and Initial Investment and then divide it by Initial Investment to calculate the profitability index.
The formula looks like the following:
Profitability Index (PI) = (Net Present Value (NPV) + Initial Investment) ÷ Initial Investment
Importance & Uses of Profitability Index Formula
The profitability index formula is essential for capital budgeting and estimating potential projects. Besides, it plays a vital role in project decision-making. To learn more about the importance and usages, consider the subsequent discussion.
Importance:
When you need to calculate the profitability per dollar of investment, rank projects based on their profitability, or make important investment decisions, the Profitability Index formula is the ultimate tool.
Usage:
While working with multiple projects, the profitability index allows you to pick the most profitable projects from all available options. It also assists in budget allocation and helps justify larger budget allocations.
In summary, the profitability index formula provides important aspects for evaluating project profitability, allocating resources efficiently, and maximizing the overall value.
Profitability Index Interpretation
The formula will show three possible outputs: Profitability Index > 1, Profitability Index < 1, and Profitability Index =1.
So, what is a good profitability index?
When the Profitability Index (PI) is greater than 1, it is considered a good profitability index, and obviously, you should move forward with this project.
If the Profitability Index (PI) is less than 1, you should not go with that project, as it will destroy the value of your business.
When the Profitability Index (PI) equals 1, it will generate a return on investment equal to the discount rate.
So, if you’ve multiple projects, calculate the profitability index and go only with projects with a Profitability Index (PI) score of more than 1.
Before starting the calculation, let’s look at the following advantages and disadvantages to understand why and when you should depend on profitability index results.
| Advantages | Disadvantages |
|---|---|
| Provide a clear understanding of the relative profitability of different projects. | Dependence on discount rate. |
| Consider both the initial investment and the future cash inflows. | Ignore project life span. |
| Summarize whether the project will create or destroy the value of the business. | |
| Useful for ranking projects based on project outcomes. |
Now that you know all the ins and outs of the formula, move down to the next section to learn how you can use the formula to calculate the profitability index.
How to Calculate Profitability Index in Excel
Before starting the calculation, gather the necessary information. In this article, I will show two different projects and assist you in choosing the most suitable one.
To perform the calculations, I added multiple data fields such as initial investment, initial investment (outflow), upcoming years’ cash flow, and discounting factor.
With all the data included, the dataset looks like the following:
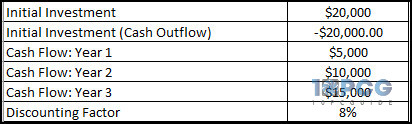
Project 01
Once your dataset is ready, let’s begin the journey by calculating the Net Present Value (NPV). We will use the =NPV(B9,B5:B8) formula to do so.
Allow me to break down the formula. Here, =NPV is the function used to calculate the net present value, B9 is the discount rate, and B5:B8 cell values are the cash flows. 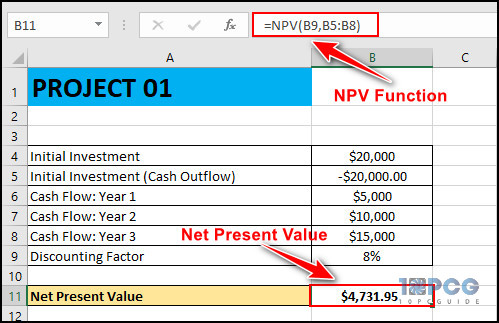
As you can see, the NPV is $4,731.95. With this result in hand, we can now calculate the profitability index.
To do so, select an empty cell and use the =(B11+B4)/B4 formula. Here, B11 is the NPV of the above dataset, and B4 is the initial investment for the project.
The selected cell will show the profitability index, which is $1.24. 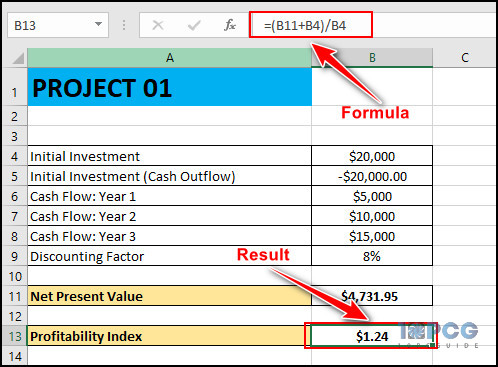
Project 02
For this project, we will use another dataset (check the following image). Similar to the first project, this project also has the same data types with different values.
First, we will calculate the Net Present Value. To do so, select a cell and type =NPV(B9,B5:B8) in the Excel formula box. Here, my dataset returns $3,961.48 as the NPV value. 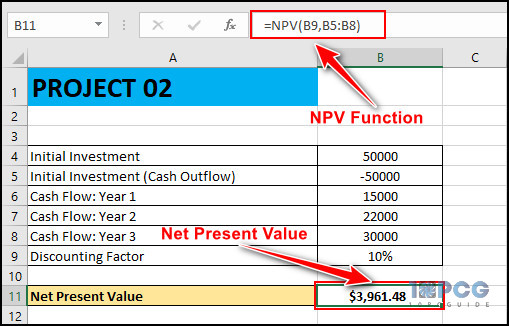
Now select another empty cell and type =(B11+B4)/B4. It will calculate the profitability index for the aforementioned dataset.
It will show the profitability index for this dataset, which is 1.079229561. This formula acts like a profitability index calculator that divides the PV of Future Cash Flows by Initial Investment.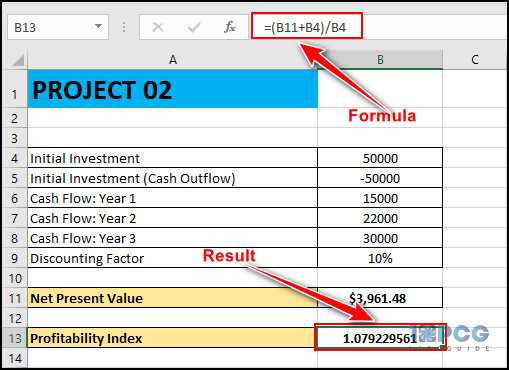
Now that we have the results for both projects, we can quickly determine which one we should go for. The profitability index of the projects is 1.24 and 1.079229561 chronologically. And the first project is the clear winner as it will bring more profit than the second project.
Wrap Up
Whether you’re an investor or business owner, the profitability index will assist you in choosing the best project that will surely generate revenues.
If you need further assistance calculating the profitability index, comment below.