Using the Top N filter to sort out the values from a data table is probably one of the most useful features in Power BI, especially when you have a huge data set. Unfortunately, the process can be troublesome to users who aren’t quite familiar with the service.
As a result, some users notice that the Top N filter in Power BI is not giving the intended result in certain cases.
There’s a valid solution for such inconvenience, along with a proper explanation as to why it wasn’t working in the first place, which I have addressed in this article.
So, let’s get straight to the topic, shall we?
What is the Top N Filter in Power BI?
The Top N filter in Power BI is an efficient filtering tool that allows users to restrict the data shown in a visualization to just the top N rows. This N can be any number that the user specifies.
Suppose you have 50 products, and you want to see the sales value of only the top 5 products. In this case, you can apply the Top N filter and input ‘5’ as the value for N.
That being said, there are some parameters that you need to abide by to deploy this filter properly. For example, you have to define the value by which the main column will be filtered.
Furthermore, since the Top N is a visual level filter, don’t expect to use it as a report level filter as well.
Possible Issues with the Top N Filter in Power BI and How to Solve Them
After employing the Top N filter in your PBI data table, you might notice that the output isn’t what you thought it would be. For example, you might have wanted to see the top 3 values, but instead, you’re seeing the top 6.
In some cases, the Power BI Top N filter may not be showing correct numbers at all or not even filtering the table.
Such issues occur due to incorrect parameters or not setting up the source values properly. And to fix these issues, we need to know exactly why they’re happening.
So, let’s thoroughly discuss this matter in a segmented way for better understanding.
Here’s why the Power BI Top N Filter is not working and how to fix it:
Power BI Top N Showing More Values
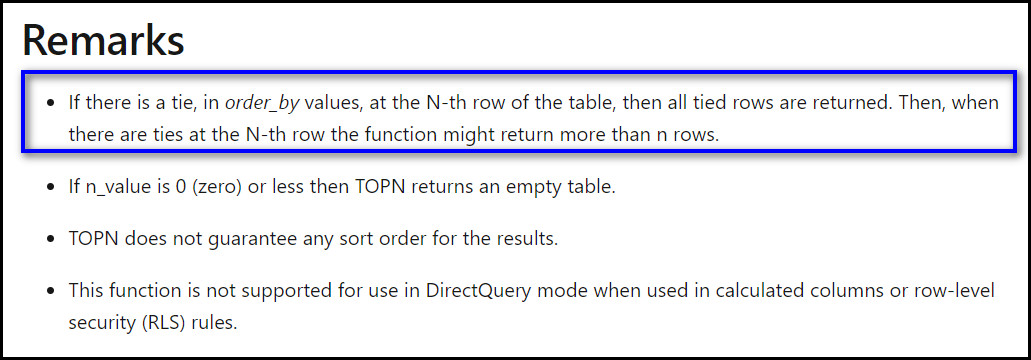
According to Microsoft’s remarks on the Top N DAX function, the Top N filter will show more than N rows if there are duplicate values or ties at the N-th row.
For example, here, I have a data set that includes duplicate sales representatives for different products. If you sort the rows with the Sales Rep column to get the top 3 values, we end up getting 6.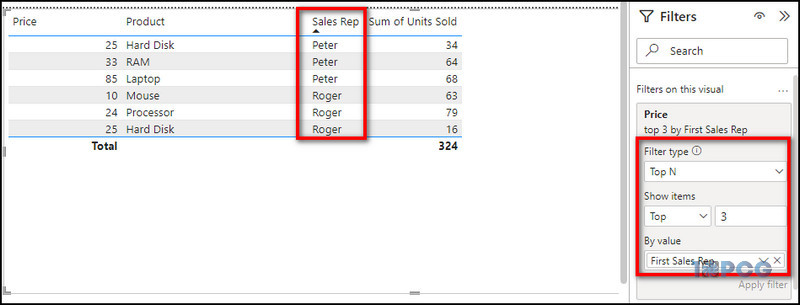
This is neither a system malfunction nor incorrect data filtering.
Hence, the only way to resolve this situation is to edit the source data(which may not be possible for most users for obvious reasons) or increase the N value to get all 3 representatives in the table view.
Top N Filter Not Showing Correct Numbers
The aforementioned filter won’t populate the table with the correct values if you haven’t inserted a field in the By Value section to specify the filter context.
Take the included image for example.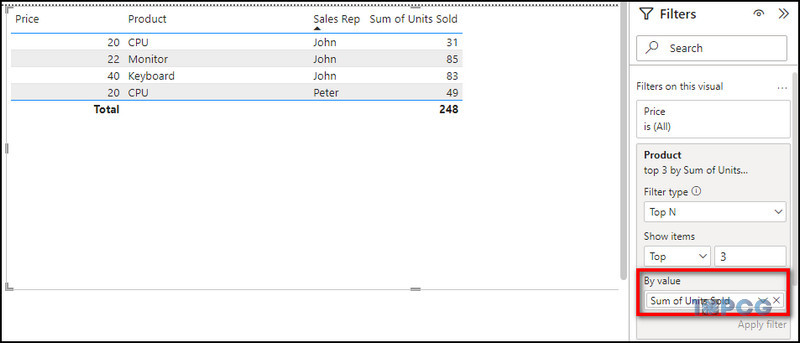
I have sorted the top 3 best-selling Products in my table with the Top N function, and I’ve added the Sums of Units Sold to the By Value field. As a result, only the products with the most sold units are being displayed.
So, if the Power BI table isn’t being populated with the correct values while using the Top N filter, make sure you’ve set the By Value and all the criteria properly for the measures used.
Alternate of Top N Filter: Use DAX Function for Index Column
Now, what can you do when you have duplicate values and need to filter them out properly without getting repeated rows?
For those instances, you can use the DAX function for the calculated column and return the top N rows and avoid the previously mentioned Top N filter’s limitation.
However, this alternate method will require you to add a new calculated/index column in descending order first. Then, apply the following DAX function:
Table = CALCULATETABLE(Data, Data[Index] >=1 && Data[Index]<=10)
Done! You can also use the newly added column to use the aforementioned filter as well. This method is quite useful to identify any trends from your dataset that may not be apparent at first.
Final Thoughts
Using this visual filter at the report level is a guaranteed way to get the Power BI Top N filter not working. So, to make the Top N filter work, users need to update the filter in case they’ve changed the source data and check if the correct filtering criteria have been selected.
That being said, I hope this write-up has provided you with everything you need to know about the topic on hand.
For further assistance, feel free to check out our website. Adios!