To reveal relationships within your data sets, understanding how to construct a least squares regression line is crucial. Microsoft Excel, a powerhouse spreadsheet tool, offers various methods to accomplish this task.
In this article, I’ll explain different ways to plot the regression line with least squares in MS Excel.
Let’s begin!
What is the Definition of Least Squares Regression Line?
The Least Squares Regression Line (LSRL) is a fundamental concept in statistics and regression analysis. It is a method used to find the best-fitting line through a set of data points, minimizing the sum of the squares of the vertical distances (residuals) between the observed and predicted values.
The goal is to create a line that best represents the overall trend of the data. It is a valuable tool for making predictions and understanding relationships between variables.
You need to apply the LSRL method when you need to make predictions based on a set of dependent and independent variables.
The concept is based on the principle that the best line is the one that minimizes the error or the sum of squared differences.
What is the Least Squares Regression Line Formula?
The Least Squares Regression Line formula is derived from the principles of minimizing the sum of squared differences.
In the context of an ordinary linear regression, where there is one independent variable (x) and one dependent variable (y), the formula for the slope (b) and y-intercept (a) of the LSRL is expressed as:
b = n(Σxy)-(Σx)(Σy)/n(Σx 2)-(Σx) 2
a = (Σy)-b(Σx)/n
Here, n represents the number of data points, Σ denotes the sum, x & y represents the variables, and xy signifies the product of the corresponding values.
The LSRL formula provides the coefficients that (a & b) define the line so you can precisely represent the relationship between the variables.
How to Plot Least Squares Regression Line in Microsoft Excel
To create a least square regression line in MS Excel, use the Scatter option in the Charts section. You can also use the LINEST function or merge the SLOPE and INTERCEPT functions built into Excel to find the regression line coefficients and plot the LSRL.
Below, I’ve provided the methods to plot the Least Squares Regression Line in Excel:
1. Insert the Scatter Chart
A scatter chart in Excel is used to visualize the relationship between two sets of data points. In regression analysis, you typically have a dependent variable (Y) and an independent variable (X). A scatter chart helps you see the overall pattern of the data points.
Here are the steps to insert the Scatter chart for linear regression analysis:
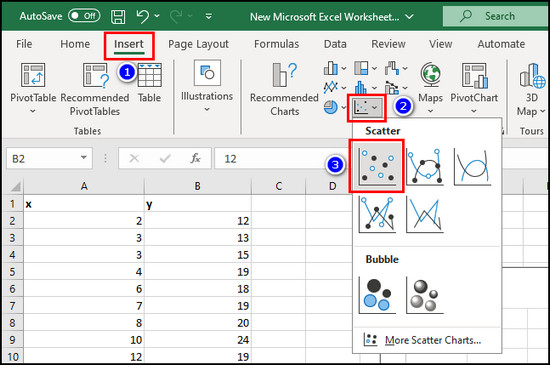
- Enter your data in two columns in Excel.
- Go to the Insert tab and choose Scatter from the Charts section.
- Click the Chart Elements button.
- Enable Trendline and choose More Options.
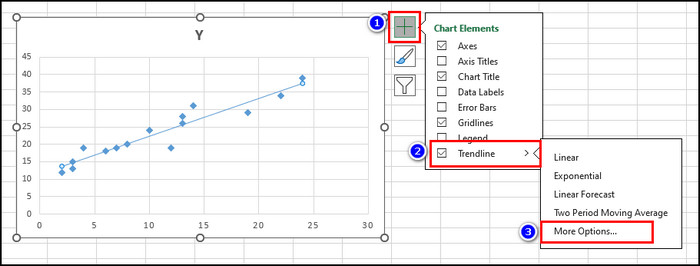
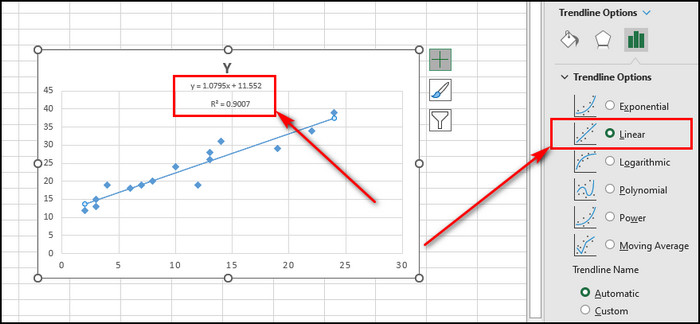
- Select the Linear option.
- Check the Display Equation on chart and Display R-squared value on chart options.
2. Use Arithmetic Formulas
You can use arithmetic formulas like the mean and standard deviation to calculate the slope and intercept of the regression line in MS Excel.
Here’s how to use arithmetic formulas to create a linear regression model:
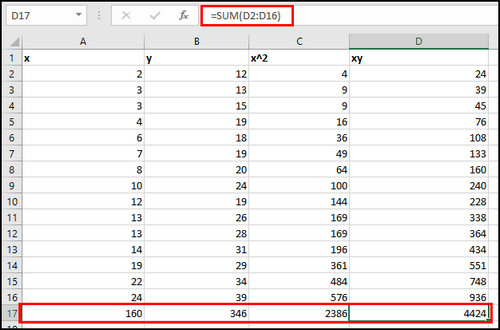
- Create a column for x2 using the =A2*A2 formula.
- Make a column for xy using the =A2*B2 formula.
- Calculate Σx using =SUM(A2:A16), Σy using =SUM(B2:B16), Σx2 using =SUM(C2:C16) and Σxy using =SUM(D2:D16).
- Calculate the slope of the regression line b = n(Σxy)-(Σx)(Σy)/n(Σx 2)-(Σx)2 using the following formula:
=(10*D17-A17*B17)/(10*C17-A17^2).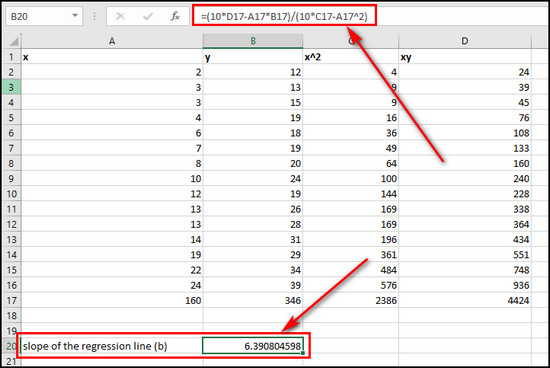
- Determine the Y-intercept of the regression line a = (Σy)-b(Σx)/n using the following formula:
=(B17-B20*A17)/10.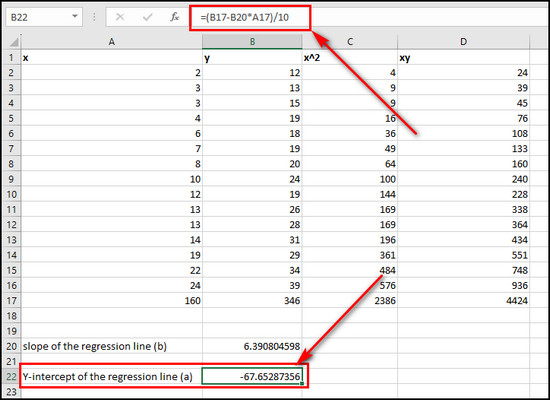
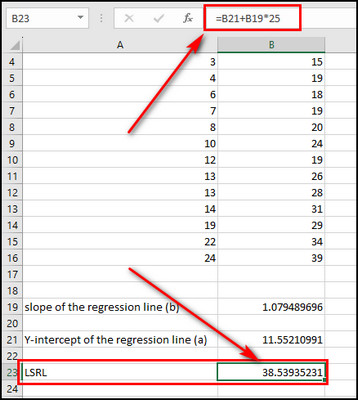
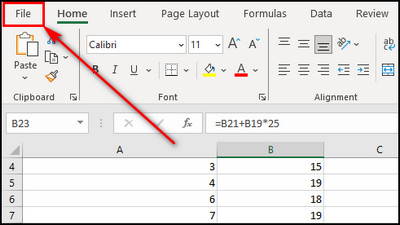
- Use the formula below to get the Least Squares Regression Line:
=B24+(B20*25).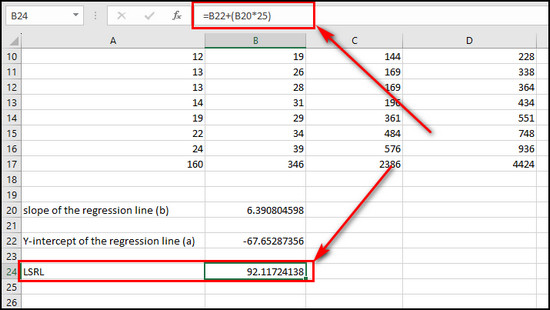
3. Utilize the LINEST Function
The LINEST function in Excel allows you to quickly find the slope of the regression line (b) and the Y-intercept of the regression line (a). So, you can use y=a+bx to get the LSRL.
Here’s the process to utilize the LINEST function to plot the Least Squares Regression Line:
- Use the following formula to determine the regression line coefficients:
=LINEST(B2:B16,A2:A16).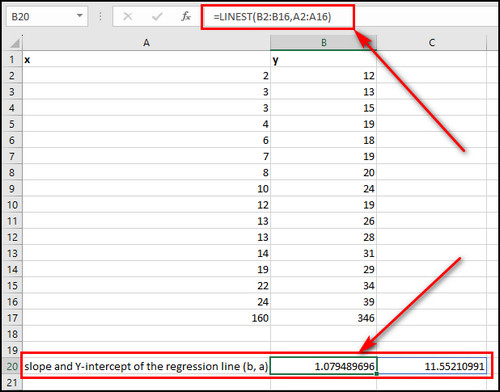
- Use the following method of least squares:
=D20+C20*25.
4. Combine SLOPE and INTERCEPT Functions
You can also use built-in SLOPE and INTERCEPT functions in Excel to calculate the slope and intercept of an LSRL. Then, use them to find the actual regression line.
Here’s how to combine SLOPE and INTERCEPT to calculate the least squares regression line:
- Enter the following formula to get the slope of the regression line:
=SLOPE(B2:B16,A2:A16).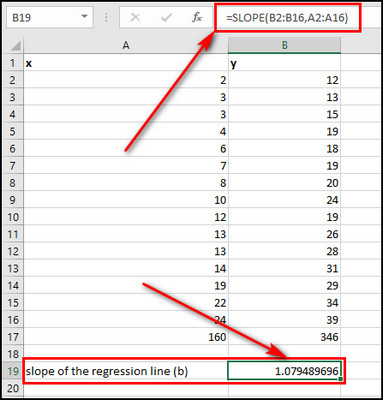
- Use the formula below to determine the Y-intercept of the regression line:
=INTERCEPT(B2:B16,A2:A16).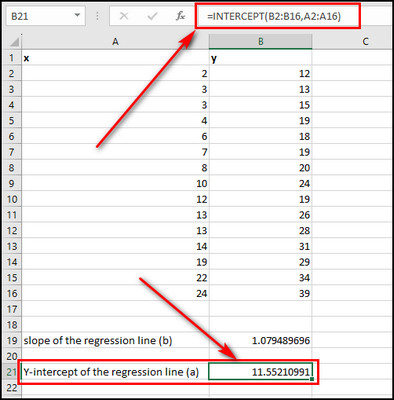
- Calculate the Least Squares Regression Line using =E22+E20*25.
5. Use the Data Analysis ToolPak
The Data Analysis ToolPak is an Excel add-in that provides additional data analysis tools, including regression analysis. It generates regression output with summary statistics, residuals, and other relevant information.
Here are the steps to use the Data Analysis ToolPak:
Enable the Analysis ToolPak
- Select File from the top right corner in MS Excel.
- Choose Options from the left menu.
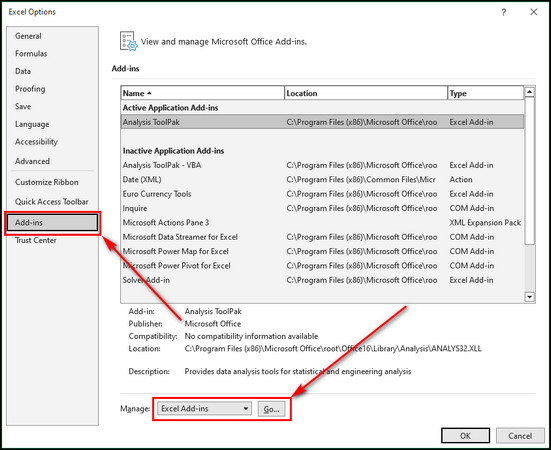
- Go to the Add-ins tab, choose Excel Add-ins, and click the Go button.
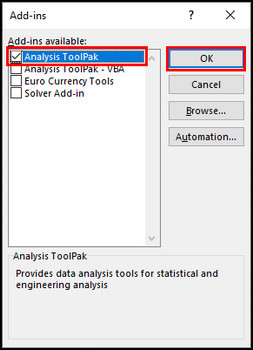
- Check Analysis ToolPak and click OK.
Use Data Analysis to Calculate LSRL
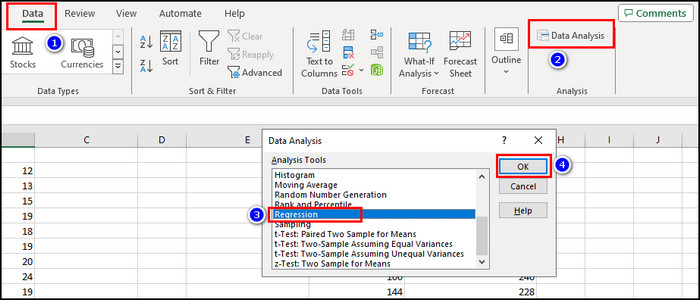
- Select Data from the top menu.
- Choose Data Analysis from the Quick Access Toolbar.
- Select Regression from the list of Analysis Tools and click OK.
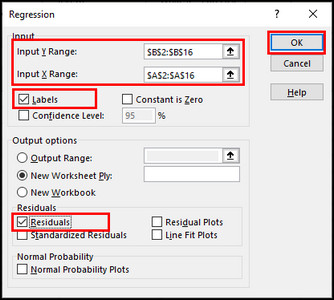
- Enter $B$2:$B$16 in the Y Range field and $A$2:$A$16 in the X Range field.
- Put checkmarks on the Labels and Residuals options and click OK.
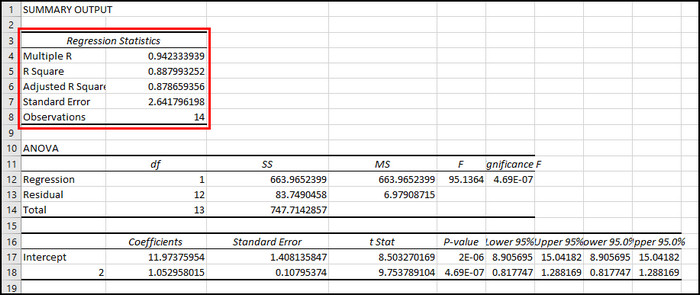
- Check the Regression Statistics table.
The above methods will cover different approaches to calculate and visualize the Least Squares Regression Line in Microsoft Excel.
Advantages and Disadvantages of Constructing a Linear Least-Squares Graph in Excel
The Least Squares Regression Line is a statistical method to find the best-fitting straight line through data points. It is simple and has predictive capabilities. However, LSRL is not helpful for non-linear data sets and is sensitive to outliers.
Here are the advantages and disadvantages of constructing a Linear Least-Squares Graph in Excel:
Advantages of Linear Regression Analysis
- The least squares regression line formula is easy to implement.
- It ensures that the line captures the general trend of the data.
- The predictive power of LSRL is valuable in finance, economics, and science.
- The least squares method provides estimates of the coefficients’ standard errors for hypothesis testing.
Disadvantages of the Linear Regression Model
- Outliers can make the regression line graph inaccurate.
- A linear regression model is inappropriate when the relationship between dependent and independent variables is nonlinear.
So, even though the least squares regression line has many advantages, it is essential to be aware of its limitations, especially when outliers are available in your data set.
Final Thoughts
Excel provides several methods to plot a least squares regression line, allowing you to choose the approach according to your data analysis. Whether utilizing the built-in functions or using scatter plots, these techniques will provide accurate and efficient regression analysis.
Comment below if you have further questions, and we’ll get back to you.