Microsoft Excel is a robust tool for data analysis. Furthermore, data tables in Excel provide a convenient way to explore different scenarios and understand the impact of changing variables on the outcome.
While the concept of a 2-variable data table may be familiar, there are instances where you might need to work with more variables.
In this article, I’ll walk you through creating a 4-variable data table in Excel. By following these simple steps, you’ll gain the skills to analyze complex data sets and perform in-depth sensitivity analysis.
Therefore, let’s get started.
What are Variables in a Data Table, and How Does it Work?
Variables are essential elements that help organize and analyze information in data tables. They represent the different aspects of data that can be measured or compared. Commonly, each data table column shows a separate variable, while rows contain values.
So, what is a Data Table in Excel?
A data table in Excel is a table that allows you to calculate multiple scenarios by changing the values of one or two input variables. It is part of the What-If Analysis tools in Excel and is particularly useful for analyzing the impact of different input values on a formula or calculation.
That said, the data table supports testing multiple scenarios simultaneously, and variables let you methodically experiment with different conditions.
For example, if you have a formula that calculates the monthly payment for a loan, you can use variables such as the loan amount and the interest rate. Also, the loan term to see how they affect the payment amount.
However, how actually variables work in data tables?
Data tables utilize variables to efficiently model scenario analyses. Variables represent parameters that can be altered, such as interest rates or sales projections. Specified input cells linked to variables accept changing values to simulate real-world fluctuations.
By adjusting variable input cells, formulas tied to output locations recalculate across the table automatically.
This allows comparing outcome variations from different inputs without manual re-entry. Leveraging variables enables simultaneous testing of multiple what-if simulations through automated spreadsheet computation.
Let’s now jump into the below section to make a 4 variables data table.
How Do You Create a 4 Variable Data Table in Excel
To create a data table with four variables means there will be four autonomous variables. With the help of the variables, you will calculate the final result.
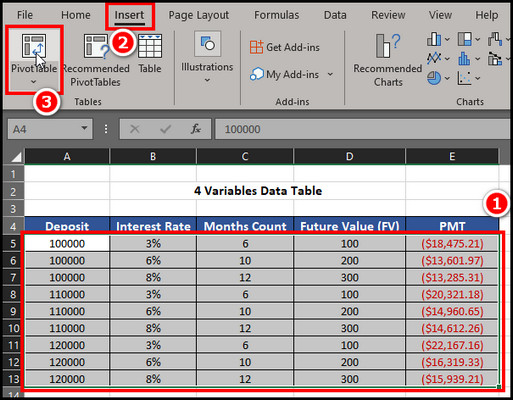
That said, let’s make a simple bank statement with the Deposit, Interest rate, Number of Months, and Future Value.
I will use this data to help you create a 4-variable data table so that you can become more familiar with data tables in Excel with multiple variables.
Here is the procedure to create a 4-variable data table in Excel:
1. Make a Database and PMT
Let’s first create some data for our data table. Follow the image instructions to create the database.
After creating the datasheet, let’s calculate the payment or PMT.
Here are the steps to calculate the payment:
- Mark the payment row and click on the Function icon.
- Search for PMT.
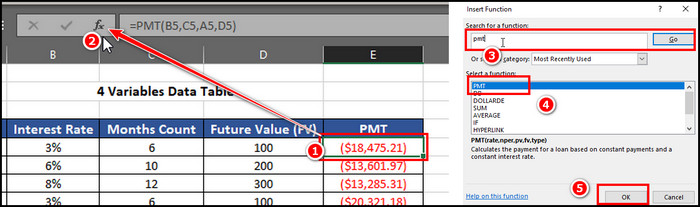
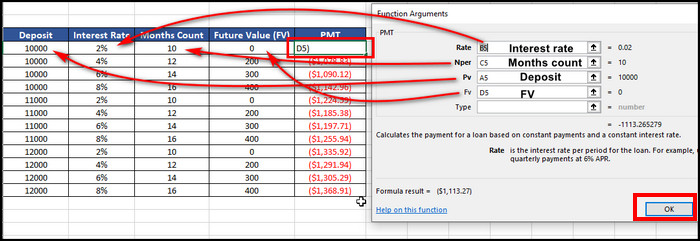
- Provide the values as the image indications.
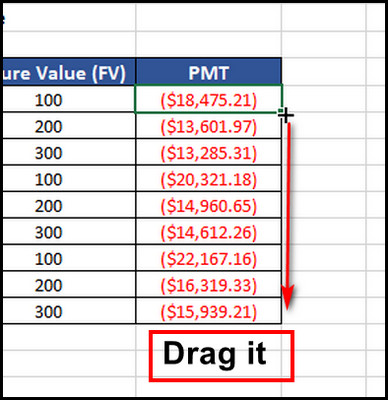
- Move your cursor to the edge of the PMT row until you see the + icon.
- Click on the plus icon and drag it to the bottom to make all the PMT rows with the same function.
2. Insert a Pivot Table
As our datasheet is ready, let’s make this datasheet into a pivot table to create a 4 variables data table.
Here are the steps to make a Pivot table:
- Mark the table without the table headings.
- Click on the Insert tab and pick PivotTable.
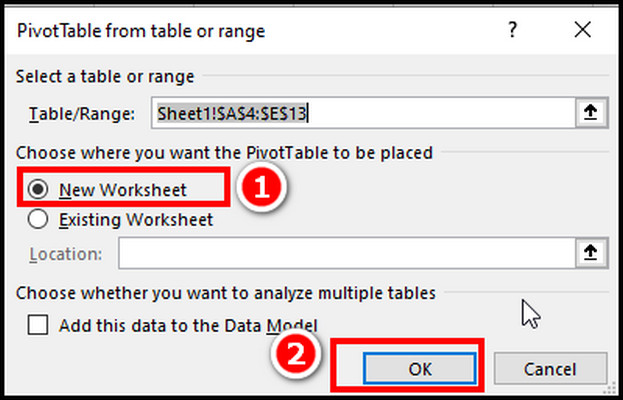
- Put a checkmark on the New Worksheet and click OK.
Now is the tricky part. On the PivotTable Fields window, you will find all the table headings. Hover your mouse over the Deposit and drag it to the Columns section. With the same process, move the Interest Rate, Months Count, and Future Value to the Rows field.
Finally, Drag the PMT to the Values section. If there are any other values in the field, click on the arrow of the value and remove it.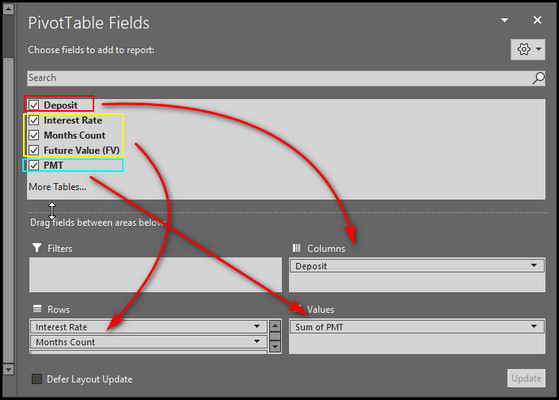
3. Transform Data Table
Now that everything is ready, we can modify the table to make it a proper four variables data table. Here is the procedure to do so.
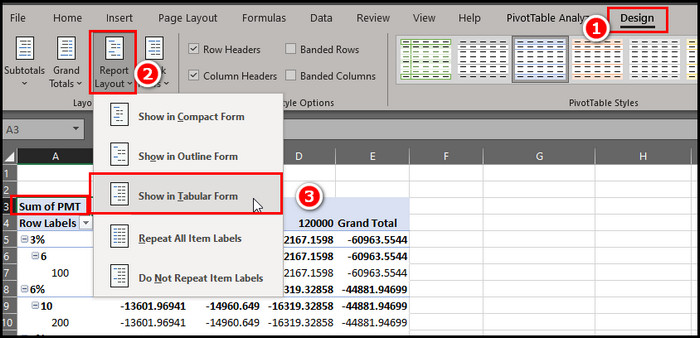
- Mark the Sum of PMT and click on the Design Tab.
- Select the Report Layout and pick Show in Tabular Form.
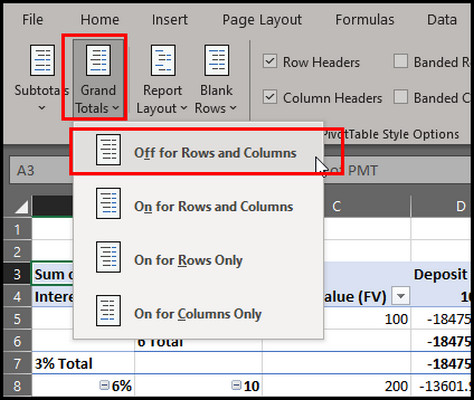
- Mark the Sum of PMT again, and while you are in the Design tab, click on Grand Totals > select Off for Rows and Columns.
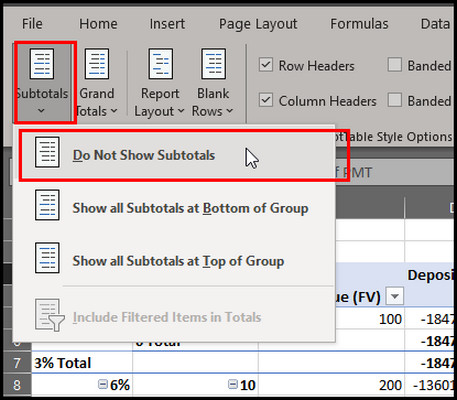
- Click on the Subtotals and pick Do Not Show Subtotals.
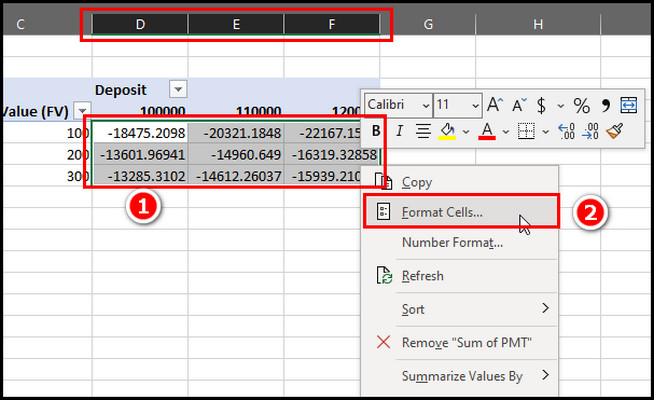
- Mark the output from D, E, F > right-click and choose Format Cells.
From the Format Cells window, pick Currency from the left pane, make Decimal places into 0, and pick an appropriate Negative number.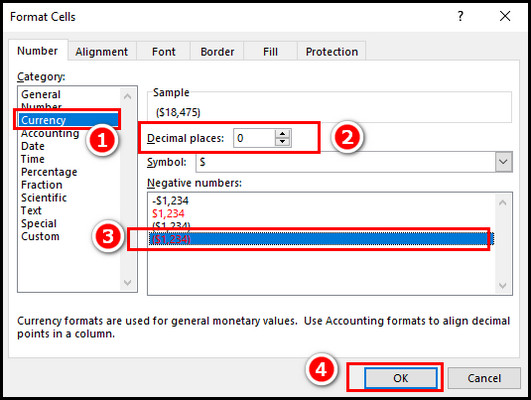
As you can see, the data table is now ready for use. It contains four variables: Variable 1(Interest Rate), Variable 2(Months Count), Variable 3(FV), and Variable 4(Deposit).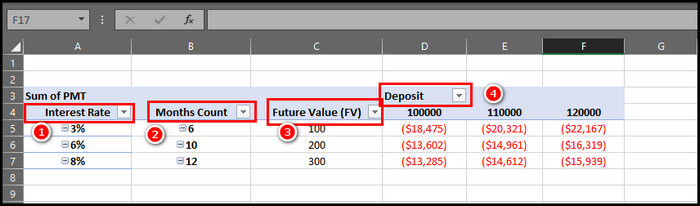
Benefits of Using Variable Data Tables in Microsoft Excel
Data tables are a very helpful tool in MS Excel for determining different outcomes without manually changing cell values and formulas each time. When working with more complex calculations, data tables can show how changing one input affects other dependent values in an organized way.
Moreover, this allows you to see certain factors’ influence on the outcome. Variable data tables are also helpful when multiple people need to analyze the same data and evaluate different options.
Having data presented clearly in a table makes it simple to recognize patterns between variables. This helps improve planning decisions.
Here are the benefits of the variable data tables in MS Excel:
Automate Calculations and Save Time
By defining input variables and output cells, you can automate the calculation of multiple scenarios without re-entering formulas manually. This preserves time and diminishes the risk of mistakes, especially when dealing with complex or repetitive calculations.
Visualize Relationships Between Variables
Clearly presents how inputs and outputs relate in a table format. Also, it makes it easier to spot trends, patterns, and dependencies.
Comprehend the impact of changes
You can easily understand how output values change when you modify the input. This gives you more profound insights into data relationships to inform decision-making with the help of variables in data tables.
Efficiently Calculate Multiple Scenarios
By allowing testing of different input value combinations, you can see how they affect formulas. This is useful for scenario and sensitivity analysis, which can help you evaluate the impact of various factors.
For example, you could use this to see how changes in interest rates would affect your mortgage payments or how changes in the price of oil would affect your company’s profits.
Wrap-Ups
I have investigated the procedure of making a 4-variable data table in Excel. By following the step-by-step instructions, you can confidently analyze and create complex scenarios and observe the impact of multiple variables on your formula’s output.
Data tables are a powerful tool for decision-making. They allow you to work with more variables, which can aid you in obtaining more profound perceptions of your data.
To get the most out of data tables, experiment with different input values and observe how the changes affect your results.