When it comes to corporate services like Microsoft Excel, things that people want to know more about are how to make it easier to use, more collaborative, and more secure for all tenants. And with the ever-evolving AI language models, Microsoft has found a way to do just that.
However, since there’s a lot more to these AI features than meets the eye, people can sometimes get confused about their usability in real life. To address such confusion, this article will provide you with a simple yet in-depth analysis of artificial intelligence in Excel.
Let’s get started.
How is AI Used in Microsoft Excel?
For the AI-based features/tools, Microsoft Excel uses advanced deep-learning language models to recognize a user’s command and automate various tasks accordingly. As a result, these tools can make the whole data entry, management, and analysis process much easier for the user.
Now, you might be wondering, what does AI in Excel mean?
Artificial Intelligence in Microsoft Excel is basically a set of tools that use machine learning algorithms to help users with data analysis, visualization, and automation. Microsoft trained these predictive AI models in their data center and deployed them into their Excel service.
Unlike other Microsoft Services, these AI models are used in a uniquely different manner for the spreadsheets.
These are some of the things you can do using the AI assistant in Excel:
- Analyze data to see trends and patterns for better insights.
- Automatically fill values in a table with pattern recognition.
- Clean up messy data.
- Auto-generate formulas based on previous entries.
- Import data entries from a piece of paper.
- Get suggestions for charts and graphs based on your inserted values.
- Create new columns from an existing example.
- Get a proper interpretation/explanation for the existing formulas.
- New ideas and types for tables or charts.
Furthermore, Excel AI bots, like Formula Bot, can transform text instructions into Excel formulas and even explain any existing ones before automatically applying them.
These are basically the advantages of artificial intelligence and why you should use them in MS Excel.
Now, let’s move on to the main topic and do a deep dive into the AI applications for MS Excel.
How to Use Artificial Intelligence Features in Excel
You can use the built-in AI features of the Microsoft Excel app in various workflows. For example, users have the option to input data entries directly from an image or a sheet of paper by using the power of AI instead of manually typing it.
In general, people need to have proper knowledge about the nits and bits/essential features like formulas, pivot tables, functions, conditional formatting, etc, to use Excel effectively.
To make this whole process easier for novice users, Microsoft has proudly deployed various AI features that can boost your productivity tenfold. And the best part is, to get these AI tools going, all you need to do is where to click or how to ask the right question.
Nonetheless, these features can be boiled down to four key aspects, which I have thoroughly discussed below, along with how to use them efficiently.
Here’s how to use artificial intelligence in Excel:
1. Insert Data Directly from Pictures
Gone are the days of manual data entry! With the power of deep-learning algorithms, image recognition has come a long way and can easily extract data from a printed/hand-written document with a single click.
Similarly, Microsoft Excel allows users to automatically import data from a picture and insert them into a completely functional and editable spreadsheet table. And that’s not all, this feature is available for both desktop and mobile app users.
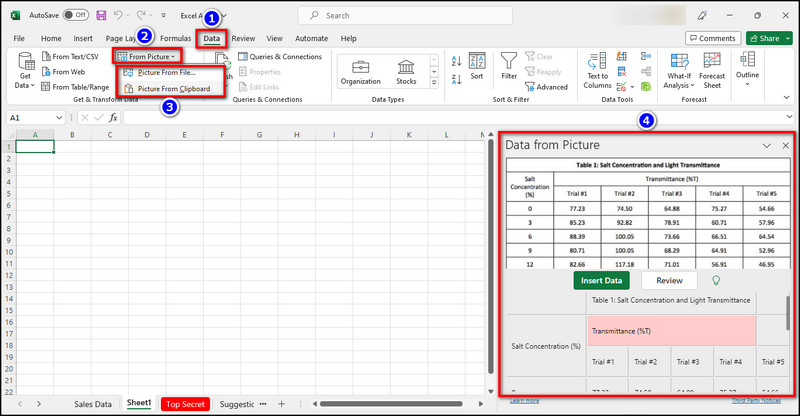
Here’s how to insert data from pictures in Microsoft Excel:
- Launch the Excel program and go to the Data tab.
- Select From Picture and click on Picture from File to import data from a saved image on your device. If you want to choose a copied image, select Picture from Clipboard.
- Wait until the program analyzes the image and imports all the data entries with a similar table format.
- Preview all the cells to check if everything is imported properly.
Note: Cells that had trouble importing all data from the image will be shown in red color. To resolve them, click on those cells and manually type the correct data. - Click on Insert Data if everything looks okay.
Now, what about handwritten/printed data tables?
In that case, you can take a picture with your phone and send that image to your PC. Then, follow the above-mentioned method to transform that hard copy into a soft copy. Alternatively, you can use the Excel Android app to do the same.
Simply run the program and click on the Show Commands icon > Insert > Data from Picture. Now, make sure there’s good lighting and take a photo of the hard copy.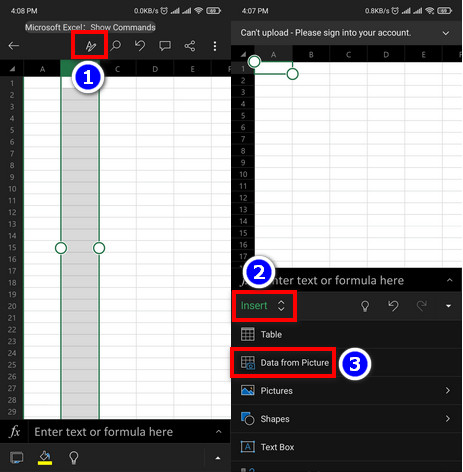
Then, select the section from where you want to import the data and let the AI do the rest.
2. Employ Intelligent Suggestions and Ideas for Data Analysis
Analyze Data, previously known as Ideas, is a fantastic AI tool that can not only provide advanced suggestions for different presentations but also offer in-depth insight for extended data analysis.
The AI model of this feature can recognize your queries and provide you with the most accurate trends and perspectives.
Let’s take a sales sheet for example. After you’ve opened it in your Excel program, go to the Home tab and click on Analyze Data from the ribbon. There, you can see a question box, along with a few suggestions.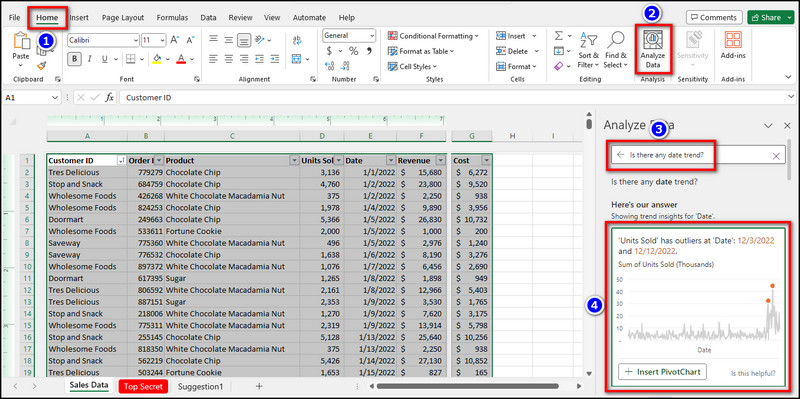
When we type “Is there a date trend?” and hit Enter, the analysis window will highlight the months when the product sold the most. Cool, right? Let’s try something else.
If we input “Are there any product insights?” and press Enter, the AI capabilities provide us with different visual representations of the query. Furthermore, you can scroll down and instantly add those suggested PivotTables shown in the analysis window into your spreadsheet.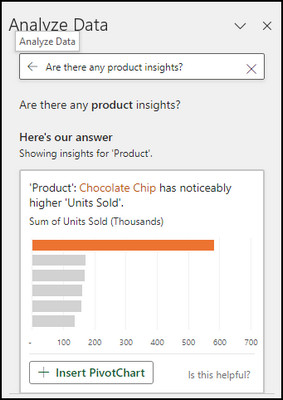
Keep in mind, you have to ask accurate and coherent questions to get the proper results. I’d recommend checking the suggested questions to get a better understanding.
3. Use New Data Types like Geography or Stock
For enterprises, geographical data is needed to get a better perspective on customer behavior, like average spending or preferred brand. Nonetheless, working with data for geographical or stock value types can be challenging for obvious reasons.
And to combat those challenges, Microsoft Excel’s AI-powered new data types can come in handy. Here’s how:
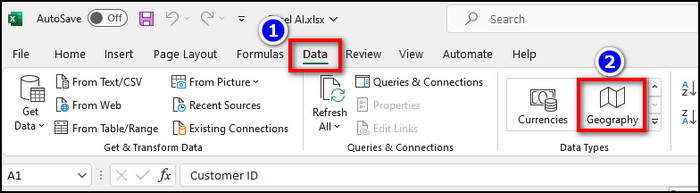
- Open the existing data table in the Microsoft Excel app and go to the Data tab.
- Select Stock or Geography from the Data Types section.
To create a real-time Stock with AI in Excel, select the whole table and choose My table has headers from the Create Table window beforehand. After selecting Stock from the top ribbon, click on the Add Column icon.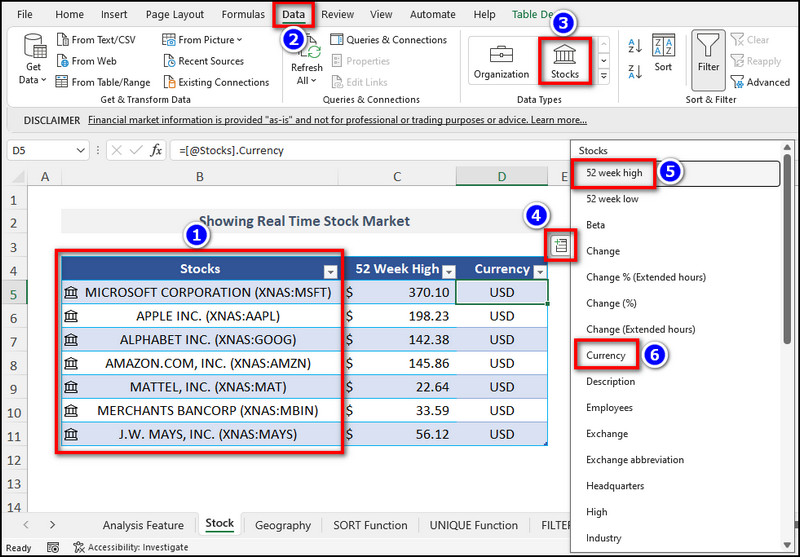
Then, choose the subsequent options accordingly. For demonstration, I’ve chosen 52 week high and Currency. Done! It will add input columns for stock values. After adding the data, you can hover your mouse over the stock icons to get an in-depth overview of the current stock value.
On the flip side, for creating a Geography data type in Excel, just type the name of the region into the table, and the AI model will automatically fetch region-specific data.
To show those corresponding data, click on the Add Column icon and choose your preferred value type, like Population of GDP.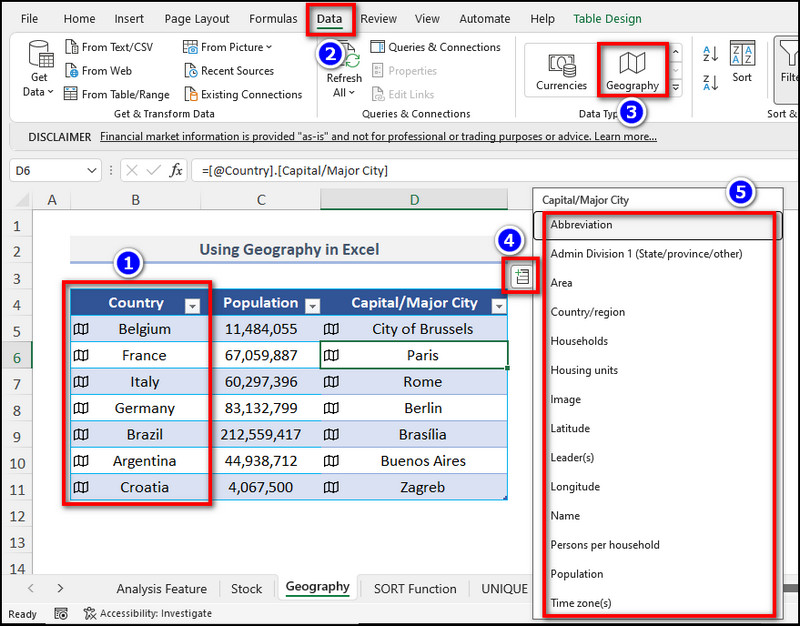
Speaking of columns, check out how to swap columns in Excel.
4. Use Dynamic Arrays
With the introduction of dynamic arrays, Microsoft Excel has given users a way to write formulas that return multiple values in spill range. But where does the AI come into play?
Well, the AI tool automatically changes the spill range upon the change of formula or source data.
There are some new functions that are designed for dynamic arrays, such as FILTER, UNIQUE, SORTBY, SEQUENCE, and RANDARRAY. These functions can help you perform various tasks with your data, such as filtering, removing duplicates, etc.
Let’s see an example of how to use dynamic arrays in Excel.
Suppose the sales table that we have has revenue data in cells A1:E11. Let’s use dynamic arrays to sort the data by region and sales amount while figuring out the average sales per country.
To do so:
- Type the formula =UNIQUE (A2:A11) in cell G2 to get the unique values in the region column.
- Enter the formula =FILTER(A2:E11,A2:A11=G2#) for the H2 cell to filter the data by region.
- Type =SORT(H2:L20,5,-1) formula for the M2 cell for sorting the filtered data by the sales value.
- Enter =AVERAGE(M2:M20) formula for the cell R2. It’ll calculate the average sales per region and return the result in the spill range R2:R5.
This is how dynamic arrays use AI algorithms to do complex data analysis with multiple values in Excel.
To learn more about the sorting process, check out how to sort by date in Excel.
Best AI Tools for Excel You Should Know About
The above-mentioned features are just the tip of the iceberg. There are a bunch of useful AI tools specifically created for Excel data analysis and handling workloads. Each of them has their unique characteristics that bring something new to the table.
But from the vast ocean of AI tools for Microsoft Excel, which one should you choose?
To help you out in this matter, I have shortlisted the best third-party AI plug-ins that can complement your workflow even further.
Here are the best AI tools for Excel best suited for power users:
- OpenAI in Excel(free for 3 months) – Based on ChatGPT, provides various ways to manipulate or manage data with simple prompts.
- Ajelix(Premium) – For translating texts into Excel formulas, writing VBA scripts, or visualizing tricky data sets.
- Excel Formula Bot(Premium) – A time-saving Excel AI assistant suitable for students.
- Arcwise AI(Premium) – Chat-based Excel assistant; allows easy debugging and cleaning messy data.
- Sheet+(Premium) – Visualizing data entries with advanced data analysis.
- Promptloop(Premium) – A user-friendly AI tool with the ability to provide formal logic and proper fixes for data entries.
Now, you might be asking yourself: which AI is best for Excel?
OpenAI is definitely the better choice as the go-to AI companion when you want to excel at Excel(no pun intended). But to be honest, this preference can vary depending on the user.
To learn more about this productivity service, check out how to unmerge cells in Microsoft Excel.
The Shortcomings of AI in Excel
After all things said and done, these artificial intelligence tools aren’t the end-all-be-all. You can’t just blindly rely on these tools to give the correct answer every time or do everything exactly the way you want.
There are certain blindspots and shortcomings that are prominent in certain work cases, which every user should know about before they start using AI in Excel.
Remember the Analyze Data feature that I’ve previously discussed? Well, in the question field, if you ask the AI to give you the total profit of your sales, it will just show you the sum of revenue. But that’s not the profit, is it?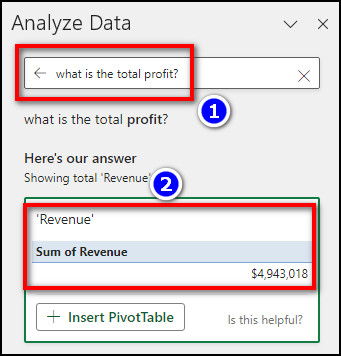
As we all know, profit=total revenue‒total cost. Hence, showing the summation of all the revenue instead of properly calculating the profit margin is a big oopsie. That’s just one example of the limitation of AI in Excel.
Here are some of the limitations and shortcomings of artificial intelligence in Excel:
- Artificial Intelligence for Microsoft Excel may not always provide the most accurate or reliable results since it pretty much runs on trained predictive models.
- These features may not be able to handle complex or ambiguous queries from users, such as analyzing data with various formats, meanings, or sources.
- It is difficult for Excel AI to handle data that is inconsistent or incomplete.
- The AI features in Microsoft Excel are not universally compatible and don’t support all devices, platforms, or Excel versions. As an example, the OpenAI/ChatGPT functions are only available for the desktop app.
To get a better understanding of the whole thing, including the legal side, I’d recommend visiting the Microsoft 365 blog.
Conclusion
Despite having a few shortcomings, there are hundreds of scenarios and use cases where AI can not only improve your workflow but also introduce many new functions that you previously had no idea how to use.
And by following this write-up to learn how to utilize the power of AI, you can surely become an Excel power user in no time.
That’s it for today. Have a great day!