Uncertainty or Error can appear anywhere, anytime, and you can measure that Error deviation with the help of the Error Bars option in MS Excel.
Suppose you are composing your company’s sales data in an Excel worksheet and want to see its error margin. Then you can simply add the Error Bars to your Excel sheet.

Adding Error bars is a very forthright and easy process. Also, you can modify this Error bar according to your specific need with some simple customization in the Format Error option.
So Without skipping, read the entire content to learn the process of adding Error Bars in different versions of Excel.
Let’s start!
How to Add Error Bars in Excel
You can apply two methods to add Error Bars to your Excel Sheet. The first is the Chart Element option, and the other is the Add Chart Element ribbon. Don’t worry; both are super easy and are stated below for your aid.
Here are the steps to add the Error Bar in Microsoft Excel:
1. Add Error Bars with Chart Element Option 
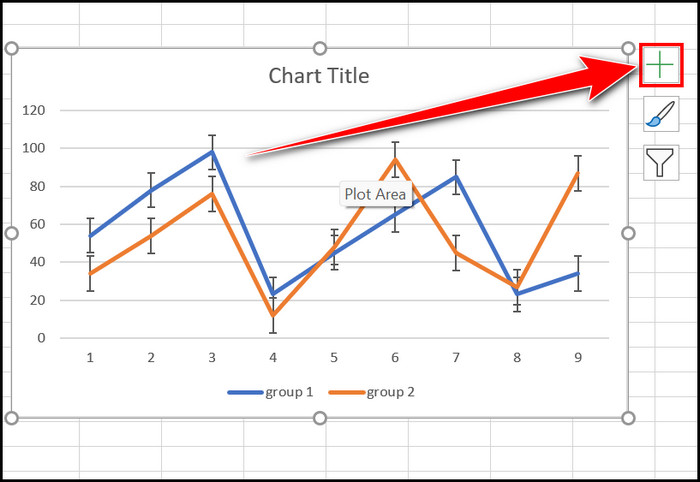
To add an Error Bar to your Chart, you must create your specific chart first, then move to the PLUS(+) icon and select the Error Bars option. Let’s head out and see how you can complete that action.
Here are the steps to add the Error bar with the Chart Element option in Excel:
- Launch the Excel Program.
- Create your desired Scatter or Line Chart with your specific data.
- Select the chart and click on the PLUS(+) icon next to the Chart.
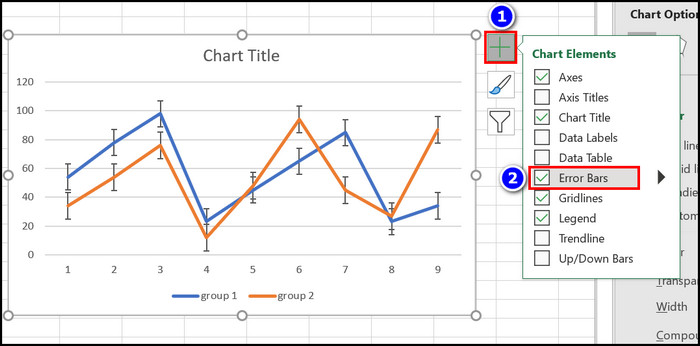
- Enable the Error Bars option.
Immediately you can see some straight error lines in the chart. Those lines are called Error Bars in Microsoft Excel.
2. Add Error Bars with Add Chart Element Ribbon
You can also add Error Bars with the Add Chart Element ribbon from the Chart Design section in Excel. Let’s find out how to complete that operation quickly.
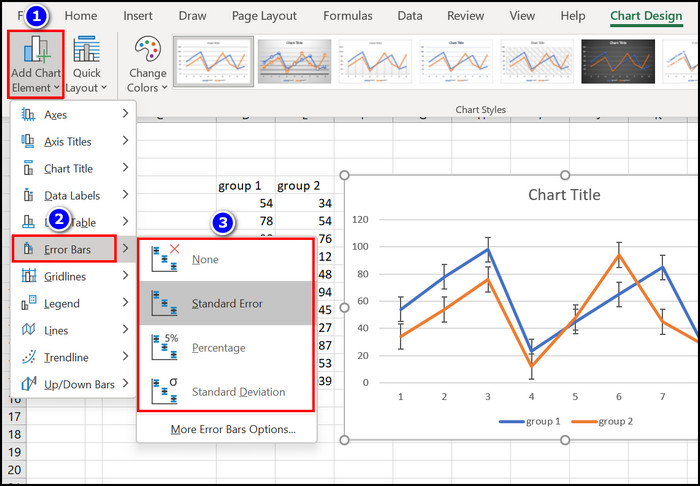
Here are the steps to add error bars with the add Chart Element ribbon in Excel:
- Open the MS Excel application.
- Input your specific data and make a chart from it.
- Navigate to the Chart Design section.
- Expand the Add Chart Element option.
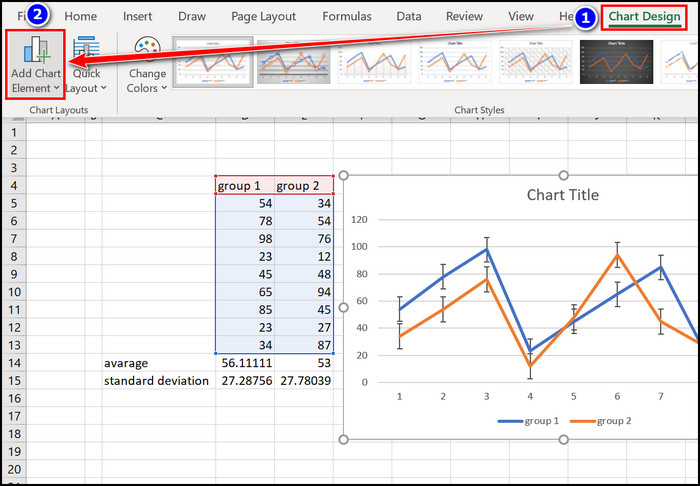
- Select the Error Bars tab and choose your desired Error Bar format.
Instantly Error Bars will appear on your Excel sheet.
Related contents you should read about how to group worksheets in Excel.
How to Change Error Bars in MS Excel with More Error Bar Options
If you want to modify your Error bars according to your specific margin, then the More Error Bar Options can assist you. You can choose Colors, Direction, End Styles and other modifications of the Error Bar from this segment.
Let’s find out how you can modify the Error Bars format in Microsoft Excel.
Here are the steps to change error bars in Excel with more error bar options:
1. Modify the Excel Error Bars with More Error Options
If you want to manually adjust the Error Bars format, you must use the More Error Bars option. Follow the instructions to finish that task.
Here are the steps to modify Excel Error Bars with more error options:
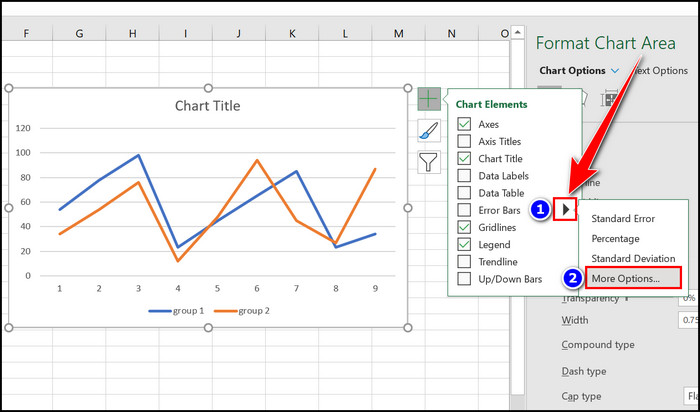
- Select the Chart from the Excel program.
- Click on the PLUS(+) icon.
- Enable the Error Bars option and click on the Arrow Sign beside it.
- Choose the More Options menu.
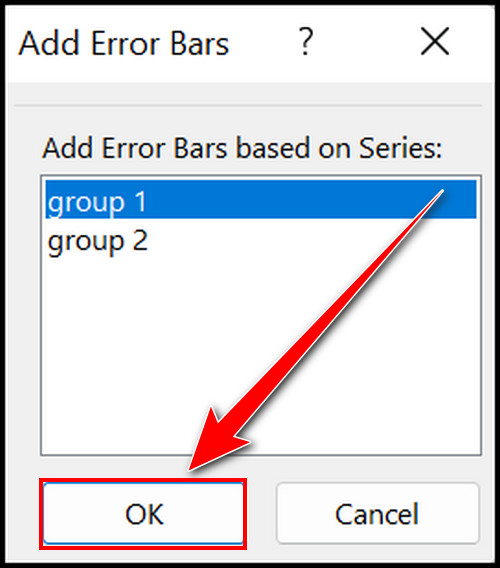
- Select the specific series for which you want to add the Error bars.
- Enable the Direction to Both option.
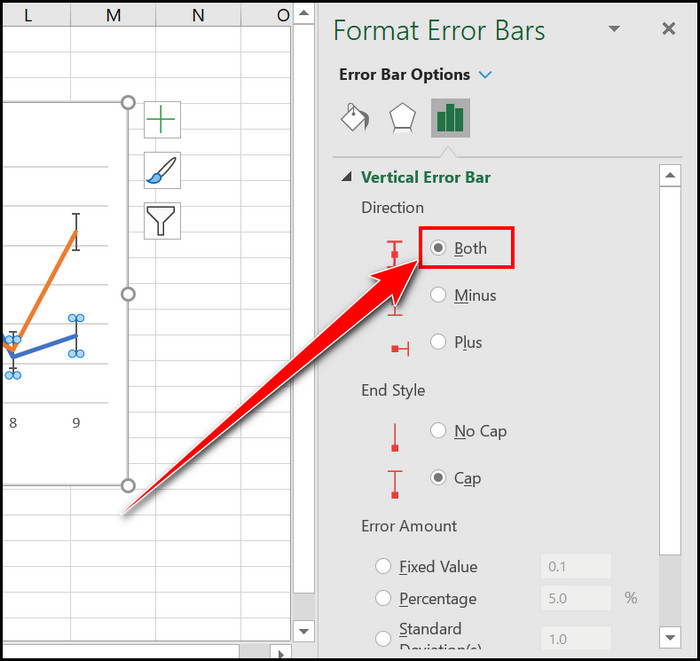
- Select the appropriate End Style.
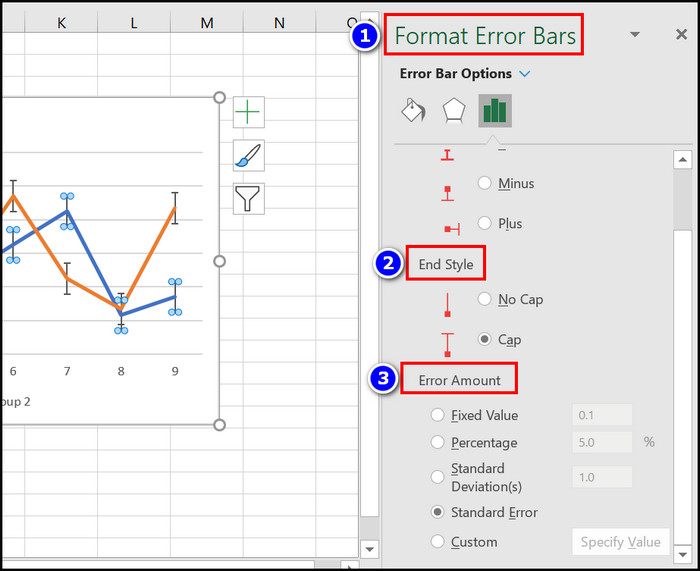
- Choose a specific Error Amount.
With the help of these simple steps, you can change your Error Bars format according to your desire.
2. Change the Excel Error Bar with Standard Deviation
If you have a specific Standard Deviation in which limit you want to see the Error Bar, follow the steps below to change your Error Bars according to your particular Standard Deviation.
Here are the steps to change the Excel error bar with Standard Deviation:
- Click on an Empty cell from the Excel sheet.
- Write =STDEV(select your specific cells) formula and make your Standard Deviation.
![excel-standard-deviation-formula]](https://10pcg.com/wp-content/uploads/excel-standard-deviation-formula.jpg)
- Make your desired chart and select it.
- Navigate to the PLUS(+) icon and select the Error Bars option.
- Click the Arrow sign next to the Error Bars option and choose More Options.
- Select the Custom box from the Error Amount section and click on the Specify Value option.
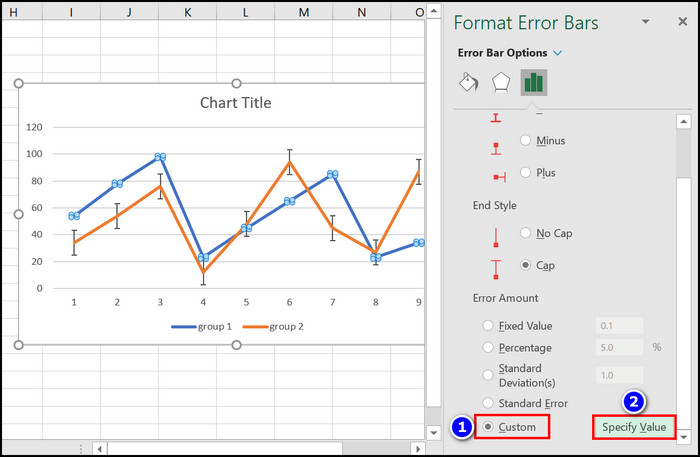
- Select your Standard Deviation cell in the Positive and Negative Error Value boxes.
- Hit the OK button.
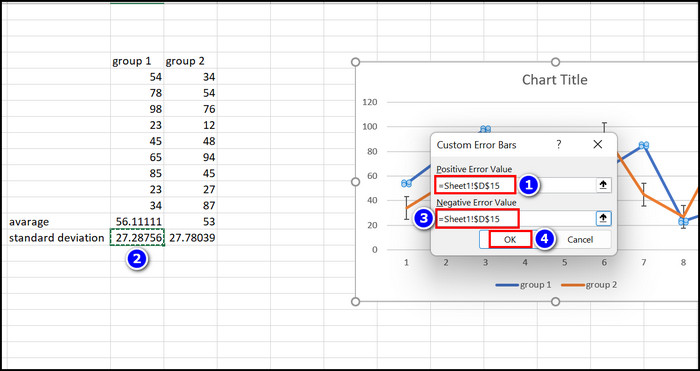
You will see that the Error Bars will display your own Standard Deviation margin. Also, you can select the automatic Standard Deviation checkbox from the Error Amount section if you don’t want to apply any formula.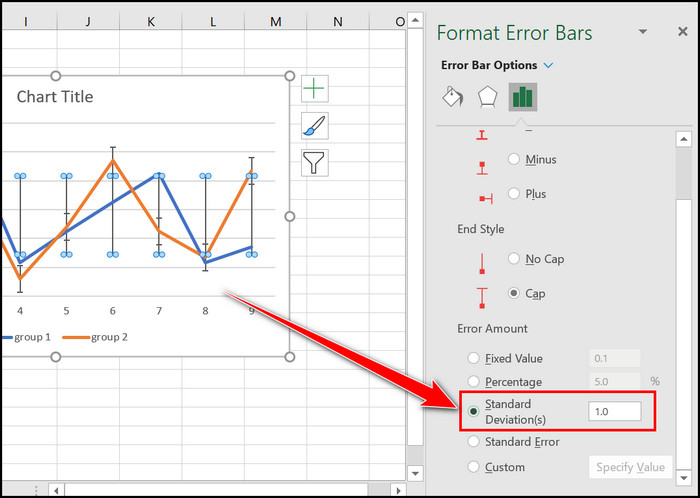
Some more guides on how to find a circular reference in Excel.
How to Add Error Bars in Scatter Plot, Line Graph and 2-D Column
To add Error Bars in the Scatter Plot, Line Graph and 2-D Graph, you must input the specific chart fast. Then, from the Chart Element menu, you can easily add Error Bars to them. For your easy understanding, I am giving brief instructions below.
Here are the steps to add error bars in scatter plots, line graphs and 2-D graphs in Excel:
Add Error Bars in Scatter Plot
- Select the data from the Excel sheet.
- Move to the Insert section.
- Click on the Insert Scatter (X, Y) or Bubble Chart option.
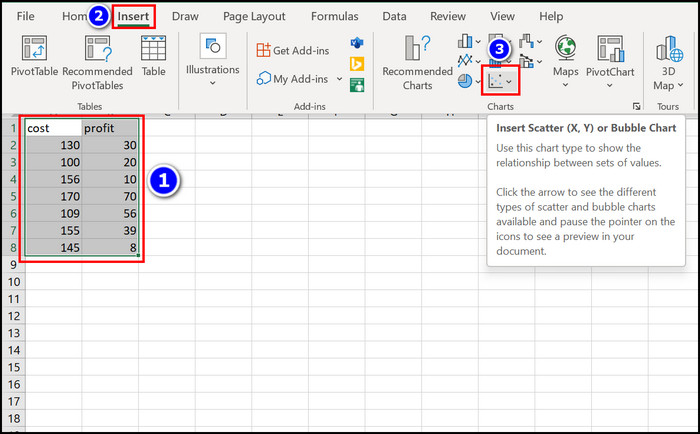
- Choose the Scatter option.
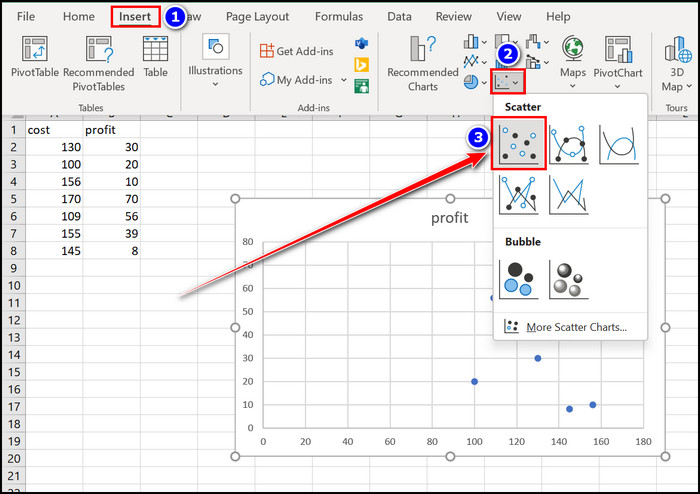
- Select the Chart and click on the PLUS(+) icon.
- Enable the Error Bars checkbox.
Add Error Bars in 2-D Line Graph
- Highlight the data cells from the MS Excel program.
- Navigate to the Insert menu.
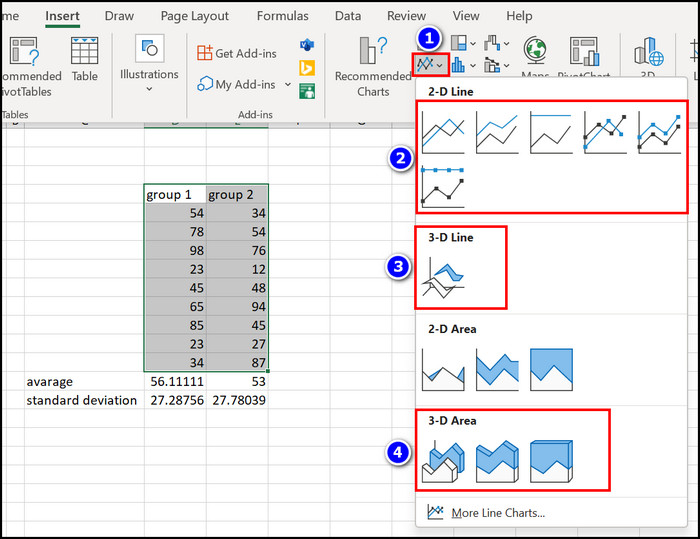
- Select the Insert Line or Area Chart option.
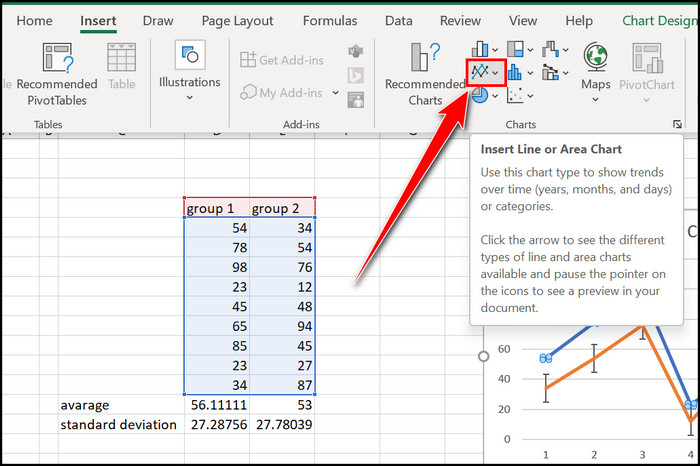
- Select your desired 2-D Line Graph.
- Click on the PLUS(+) icon beside the appearing chart.
- Check the Error Bars box.
Add Error Bars in 2-D Column
- Select the specific cell data from the Excel application.
- Click on the Insert section.
- Choose the Insert Column or Bar Chart option.
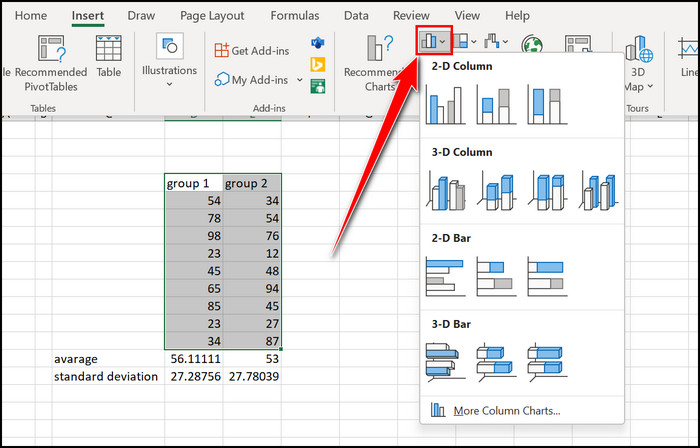
- Select your desired 2-D or 3-D Column.
- Click on the PLUS(+) sign.
- Enable the Error Bars box.
With these simple and effective steps, you can easily add Error Bars to your desired Excel sheet.
Check out the easiest way how to add a total row in Excel.
How to Add Error Bars in Microsoft Excel on Mac
MS Excel is also available for the Mac OS. If you want to add Error Bars to your MS Excel Mac, you can do it easily with the steps below.
Here are the steps to add error bars in MS Excel Mac:
- Create your specific chart in the MS Excel application.
- Select that chart.
- Move to the Chart Design tab.
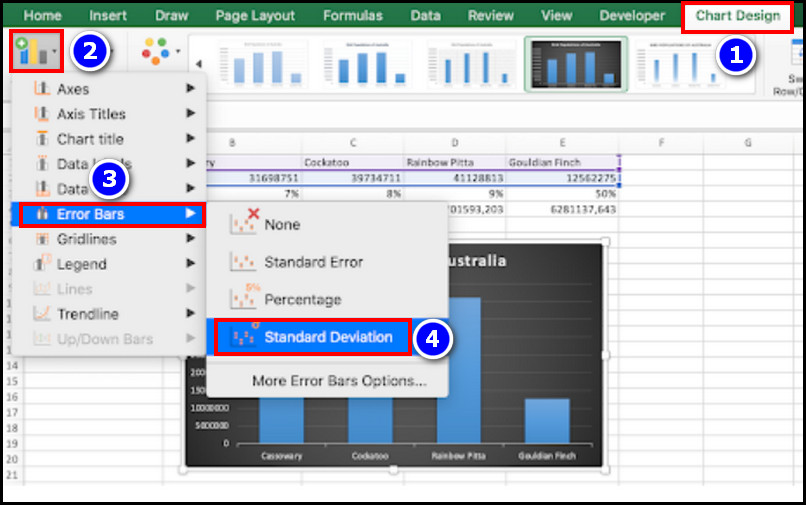
- Click on the Add Chart Element menu from the Edge of the Excel window.
- Select the Error Bars option.
- Choose Standard Error, Percentage or Standard Deviation Error option.
- Select the More Error Bar Options to modify the Error Bar format.
Immediately you will see some Error Bars in your Mac Excel spreadsheet. Read the next segment if you use Excel 2007 and 2010 versions.
Follow our guide for add leading zeros in Excel.
How to Add Error Bar in MS Excel 2007 and 2010
In the previous versions of the Excel program, the Error Bars option is in the Layout section. That function is changed in recent versions such as Excel 2013, 2017, 2019, and 2020.
Let’s sort out how you can add Error bars in MS 2007 and 2010.
Here are the steps to add error bars in Microsoft Excel 2007 and 2010:
- Make your desired chart with the specific data from Excel.
- Select the data and move to the Layout section.
- Click on the Error Bars option from this segment.
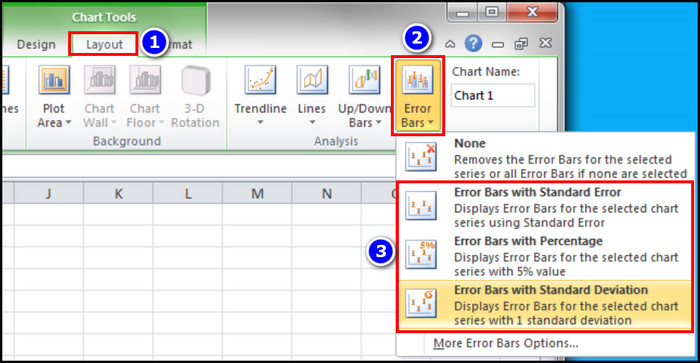
- Choose the Error Bars with Standard Error, Error Bars with Percentage or Error Bars with Standard Deviation options.
This simple process lets you quickly add Error Bars to your Microsoft Excel sheet.
FAQs
Is Error Bars the same as Standard Deviation?
No, Error Bars are not the same as Standard Deviation, but you can measure Error Bar with Standard Deviation, Percentage and Standard Error.
What is the use of Error Bars in Excel?
Error Bars in Excel are used to identify Uncertainty or Error in a specific datasheet. Error Bars also display the varying Error limit within a sheet.
Where are the Error Bars in Excel 2021?
To add Error Bars in Excel 2021, you first need to create a chart, click on the PLUS(+) icon and Enable the Error Bars option.
Wrapping Up
Adding the Error Bars in an Excel sheet can help us understand that specific data’s uncertainty.
You can easily add Error Bars with the help of the Chart Element and Add Chart Element Options. This Error Bar function can measure Error with Standard Deviation, Percentage and Standard Error.
However, you already know all that. Because those methods and additional Excel infographics are displayed in this article, you must read and follow them correctly.
Let me know your afterthoughts about this content in the comment below.