Giving presentations with written documents is long gone. People prefer visualization because they are more influential and easy to understand.
The fishbone diagram is an excellent example of a visual presentation that describes the reason for a problem easily. You can comprehend more people at once by adding some simple drawings.
They are straightforward to add, and here, I’ll show how you can create a fishbone diagram quickly.
So, let’s begin.
How to Make a Fishbone Diagram in Microsoft Word
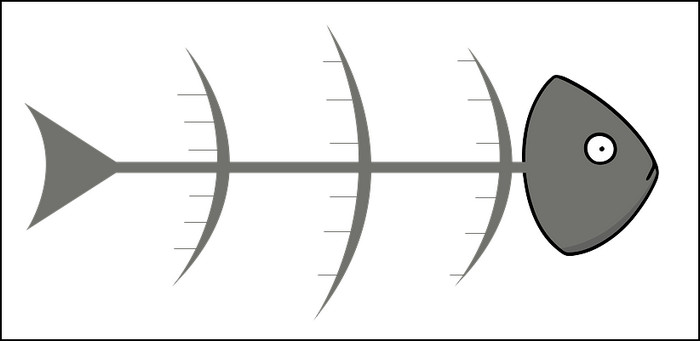
After that, you can put text around the bones to describe the topic, their reason & causes to complete the fishbone diagram design.
The fishbone diagram, often known as an ishikawa, is a cause-and-effect diagram that visualizes the potential reason for a problem. It’s used to identify the root cause and find effective solutions.
Consider implementing the following procedures to draw a fishbone diagram in your Microsoft Word document.
Here are the steps to create a fishbone diagram in Microsoft Word:
Step 1: Draw Triangle Shape
The topic or effect name is denoted by a triangle. You can insert an isosceles triangle to indicate the effect or the topic name.
Follow the process below to insert a triangle for the effect/ topic name:
- Go to the Insert tab and press on Shapes.
- Click on the Isosceles triangle.
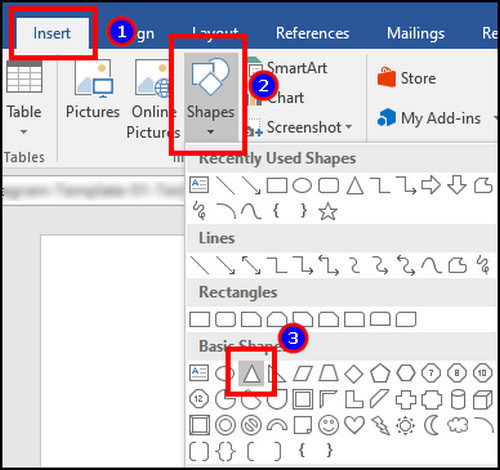
- Drag your mouse pointer to draw the triangle.
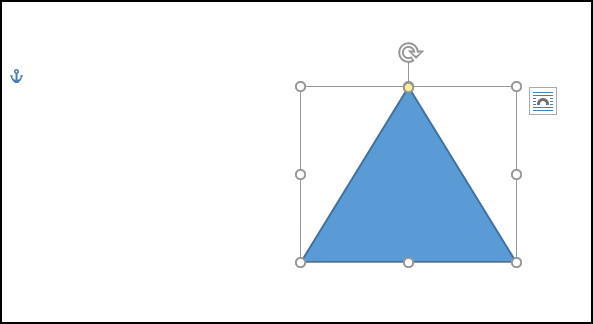
- Rotate the triangle.
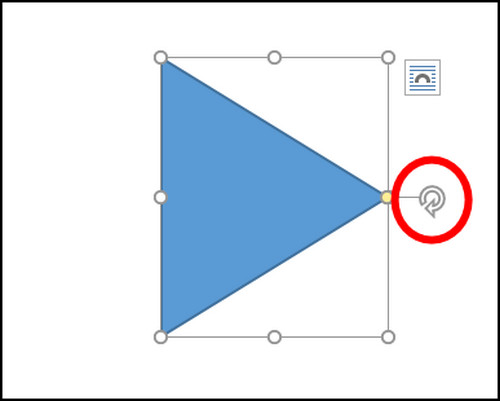
The triangles are generally placed at the right side of your page, and the corner will face towards the border.
Step 2: Draw Root Cause Lines
After inserting the effect triangle, draw and connect lines to indicate the root causes. Then, you have to insert small diagonal lines to the left and right of the main line.
Here is the way to draw root causes lines:
- Insert line from the Shapes.
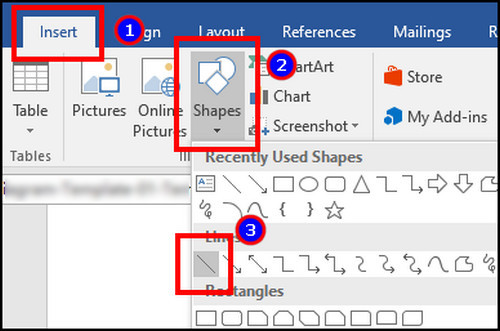
- Draw the root causes line and connect it with the triangle.

- Add diagonal lines on the left and right side for the causes.
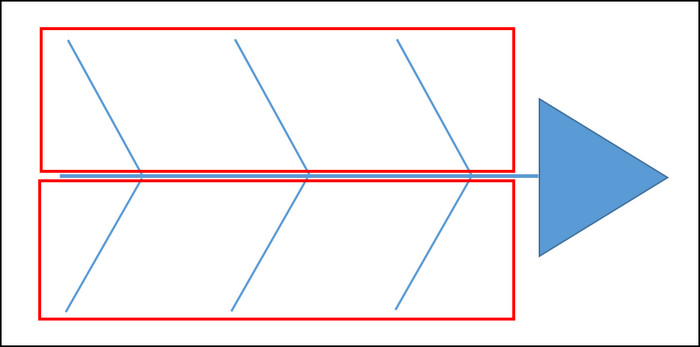
The root cause line will hold and connect the diagonal line to the effect triangle.
Step 3: Draw Branching Lines
You can insert more branching lines with diagonal lines to describe the causes or brainstorm ideas.
Check the following method to draw branching lines:
- Add lines from Shapes.
- Insert them horizontally with the diagonal lines.
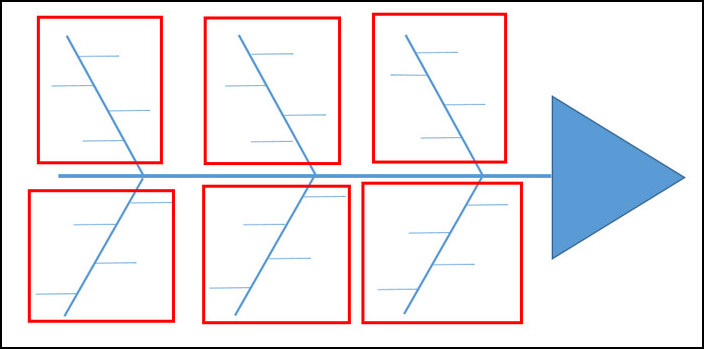
The horizontal lines are used to hold the text box in the diagram.
Step 4: Insert the Effect & Causes Text
The above three steps have shown the way to draw the fishbone diagram. Now, it’s time to complete the diagram by inserting the required text. You can use a text box to write the effects and causes.
Here is the process to insert the text box:
- Go to the Insert tab.
- Click on the Text box and select the Simple Text Box.
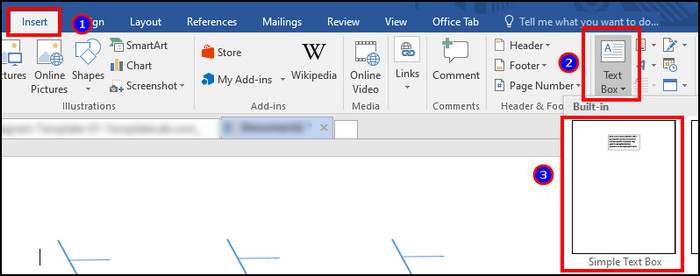
- Type and insert the effect or cause name to its place.
After inserting shapes and text, the diagram will take the form of a fishbone.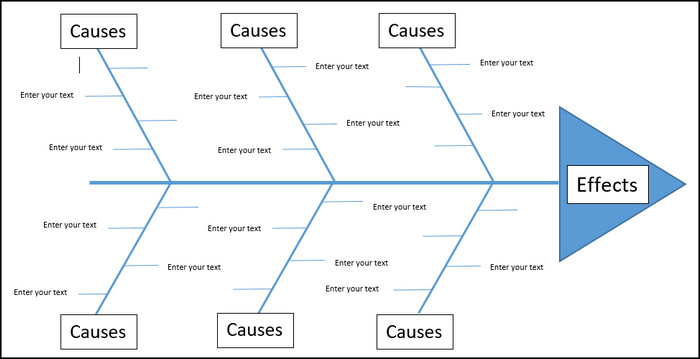
You can also download and use the fishbone diagram template from below to save your precious time.
Download Fishbone Diagram »Wrapping Up
Fishbone diagrams are widely used in meetings to describe an issue and bring solutions.
Implementing it in Microsoft Word has made the presentation more effortless for the users. You can add triangle & line shapes and insert text boxes around them to write the causes in the fishbone diagram.
Cheers!