Foretelling is a supernatural means of describing events beforehand. In the business sector, people call it Forecasting.
It’s an amazing way to portray the future outcome of a company with data and charts. But, the path has never been so easy. It’s full of complicated methods and analysis.
Fortunately, Microsoft Excel has brought a Forecast feature for Excel 2016 and onwards that predicts the future. In this article, I’ll provide in-depth information and perform the forecasting in Excel.
So, let’s start.
What is Forecasting in Excel?
Data analysis forecasting in Microsoft Excel is a process of using historical time-based data to predict future values. Excel provides a handful of forecasting tools and functions that can be used to foretell various types of data, such as sales, customer demands, inventory, etc.
Let’s make forecasting easier with an example.
Suppose a company made a profit of $10,000 in 2021 and $12,000 in 2022. So, how much would they profit in 2023?
According to the data of the previous two years, they made 20% more profit in 2022. Given the increasing profit, we can predict or forecast a 20% increase in 2023 compared to last year.
That makes a $14,400 profit for the company at the end of 2023.
This is a simpler version of forecasting. The calculations are more complex in the real world, and the Forecasting option in Excel does the prediction for you.
Why Should You Use Excel Data Analysis Forecasting?
You should use Forecasting in Excel to quickly analyze the sales, demands, inventory, and other data. It helps you to improve decision-making by providing future predictions. You can use the data to increase the profit outcome and minimize the risk.
The following passage will elaborate on the use and importance of data analysis forecasting in Microsoft Excel.
Here are the uses of Excel data analysis forecasting:
Easier Data Analysis
The forecasting analyzes the present data and predicts the future outcome with a chart or table. The visual representation makes studying the data and seeing possible results easier.
Improves Decision Making
Decision-making is a crucial part of a company or business. To make the right choice, you must require sufficient data and information.
Forecasting provides the necessary details and improves your decision-making in the present and future stages.
Increases Profitability
The right decision at the right moment is the key to success.
With the help of forecasting, you can make changes or make decisions at the perfect time and increase the profit outcome in your company.
Reduces Risk
The forecasting analyzes the previous data and predicts the future. You can modify the prediction by tweaking the possibilities and success rate. It will give you an idea about the outcome in different circumstances.
The review gives you multiple options, and with those, you can avoid disadvantages and reduce the risk.
There are multiple methods to forecast an outcome in Microsoft Excel, and the following passage will describe them in detail.
How to Perform Data Analysis Forecasting in Microsoft Excel
To perform the data analysis forecasting in Microsoft Excel, you can use the ETS (Exponential Triple Smoothing) method to represent the data in a chart efficiently. In addition, you can use Moving Averages and Linear Regression to predict future results.
There are three primary methods of Forecasting in Excel: They are:
- Exponential Triple Smoothing
- Moving Averages
- Linear Regression
We will explain and use each to forecast the outcome with Microsoft Excel. Consider following the methods below to predict the data.
Here are the methods to perform data analysis forecasting in Microsoft Excel:
1. Exponential Triple Smoothing
Exponential Triple Smoothing, or ETS, is the most straightforward process to forecast sales in Excel based on historical data. It provides a forecast, lower confidence bound, and upper confidence bound information in a separate sheet.
Follow the process below to use Exponential Triple Smoothing to forecast in Excel:
- Open the spreadsheet in Microsoft Excel.
- Select the date and value ranges.
- Go to Data from the ribbon.
- Press on Forecast Sheet.
- Click on Create.
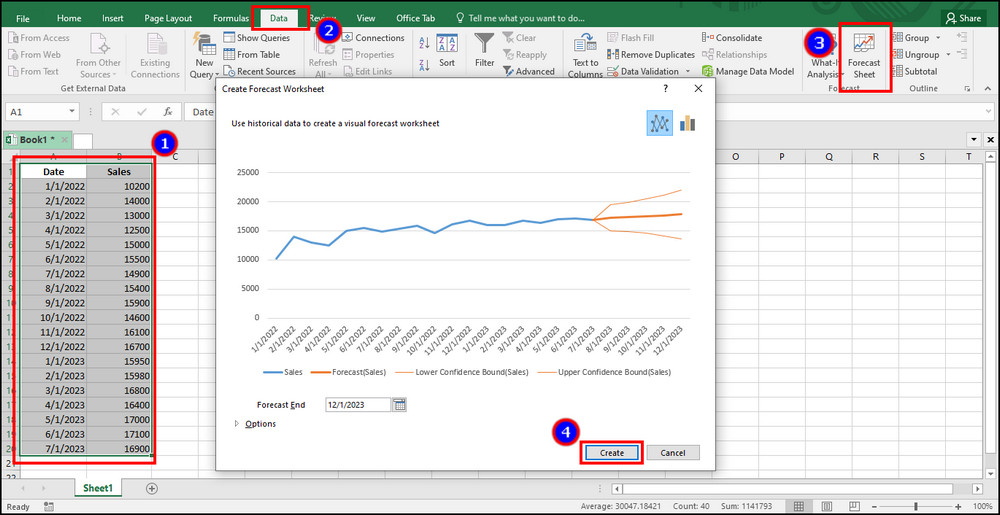
It will create another sheet and provide the forecast, lower confidence bound, and upper confidence bound data.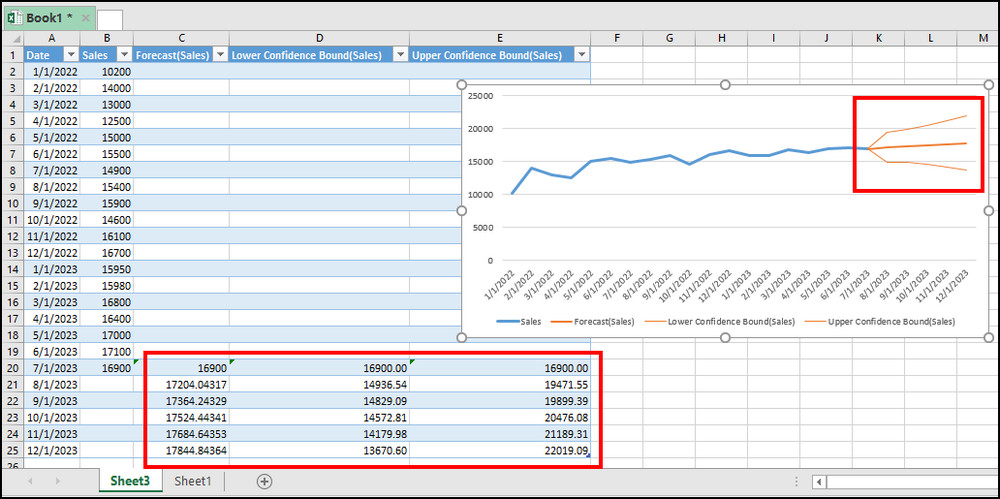
The newly created sheet will include information till the Forecast End. The blue line in the chart describes the actual data, and the orange line describes the forecast data.
The upper orange line is the upper confidence bound, and the lower orange line is the lower confidence bound.
2. Moving Averages
The moving average is an ordinary way to create a forecast in Excel. In this way, you need to calculate the average of a range and predict the upcoming result.
Here is the way to forecast data using moving averages in Excel:
- Select the desired cell and type the AVERAGE() function.
- Press enter and drag to autofill data.
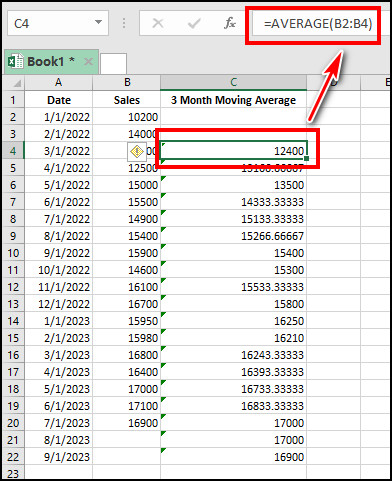
- Select the full data and go to the Insert tab.
- Insert a line chart.
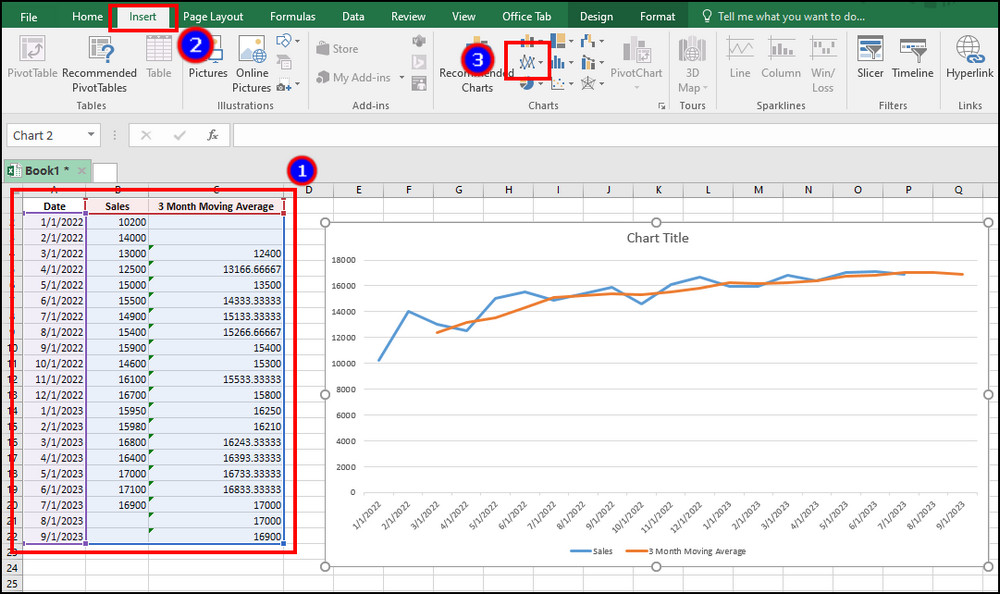
The blue line indicates your current data and the orange line shows the average forecasting data.
3. Linear Regression
The linear regression uses the Y=a+bx formula to predict the future result. You can apply the method in Excel by using the FORECAST.LINEAR function.
You will need a range of date and values in the linear regression formula. You need to specify the upcoming dates and predict the values based on the previous result.
Read the procedure below to apply linear regression to forecast data in Excel:
- Type the FORECAST.LINEAR(date_cell,value_range,date_range) function in a cell.
- Drag to autofill the following cells.
- Select the table and insert a chart.
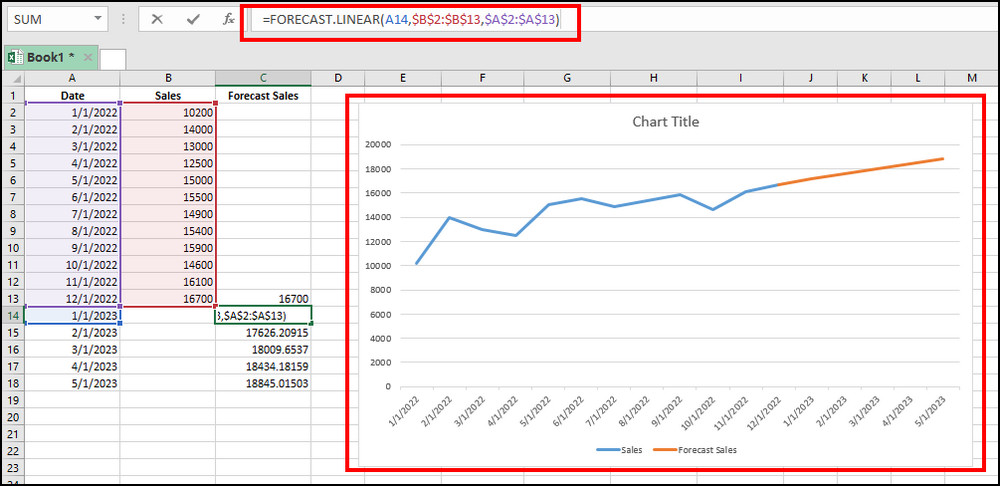
Remember to put the absolute ($) sign before value_range and date_range to get the accurate result.
The blue line in the chart is the actual data, and the orange denotes the future outcome.
Download Practice Worksheet
I’ve included all the examples used in this article in the following Excel practice worksheet.
You can download and check the forecasting models in the Excel templates below.
Download Practice Worksheet »How to Customize Forecast Options
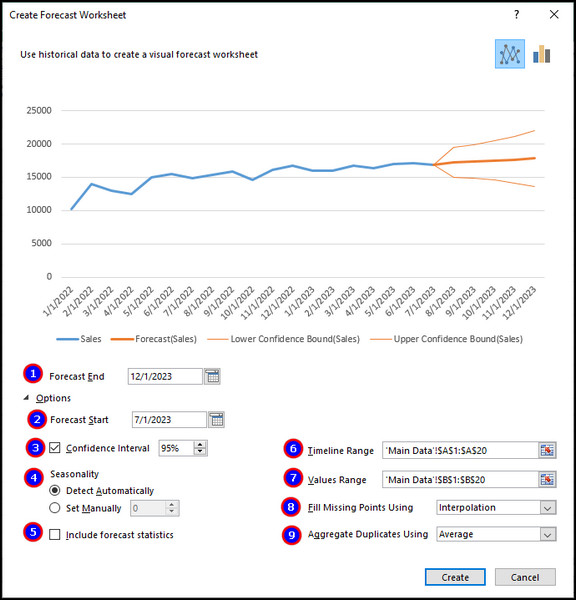
The Exponential Triple Smoothing Forecast sheet provides advanced options to customize the chart and deliver additional data.
The main features are Forecast End, Confidence Interval, and Seasonality. The options are used to modify the range and values.
Read the following passage to learn about the forecasting options in Excel:
| No | Option/Feature | Description |
|---|---|---|
| 1 | Forecast End | It describes the ending date of the forecasting. You can increase or decrease the values provided in the chart to check further analysis. |
| 2 | Forecast Start | Forecast Start is the first setting you will notice after expanding the Options. Usually, the forecasting begins from the ending point of actual data. But, you can back the start date to see predictions of Excel about the past. |
| 3 | Confidence Interval | It shows the range of future data points with fall expectancy at a certain confidence percentage. The default confidence interval value is 95%. |
| 4 | Seasonality | The seasonality options are set to automatic by default. If your company has a three or four-month season, you can set it manually and type the season count. |
| 5 | Include forecast statistics | It shows additional information, such as Alpha, Beta, Gamma, MASE, SMAPE, MAE, and RMSE. |
| 6 | Timeline Range | It shows the range of time for your data. |
| 7 | Values Range | It is the range of actual value provided in the sheet. |
| 8 | Fill Missing Points Using | The missing points fill the data by choosing neighboring values by Interpolation. Selecting the Zero will not provide any values in the missing point. |
| 9 | Aggregate Duplicates Using | This option determines how an Excel worksheet will handle multiple values in a single timeline. You can choose Average, Count, CountA, Max, Min, Median, and Sum. |
You can customize the worksheet and forecast the outcome using the above options.
How Accurate is Excel Forecast Function?
The forecast function in Microsoft Excel is quite accurate when you provide tons of information and good quality data. The forecasting depends on certain criteria, and they are:
- Quality of the historical data used to create the forecast.
- Methods used to forecast.
- Complexity of the data and the relationships between the different variables.
Therefore, it’s suggested to use the best, accurate, and multiple information to improve the prediction and minimize the error in Excel data analysis forecasting.
Ending Note
Forecasting is an important part of data analysis for a company. Every business needs to predict and approach the future for the best result and outcome.
You can analyze the data by using Exponential Triple Smoothing, Moving Averages, and Linear Regression and perform forecasting in Excel.
I’ve provided every piece of information in this article, and I hope you’ve found it easy and helpful.
Cheers!