Analyzing geospatial data makes it easier to visualize anything based on the location on the world map. From retail stores to the government, geospatial data is essential to refine the data analysis for everyone.
In this guide, I will cover all the ins and outs of geospatial data analysis (benefits, data types, usage) and demonstrate how you can effortlessly visualize the geospatial data using ArcGIS maps on Power BI.
Without further ado, let’s begin!
What is Geospatial Data Analysis?
Geospatial data analysis is a particular type of data analysis that is used to visualize things based on their position on Earth. Usually, this method is widely used to demonstrate how objects, people, or natural phenomena interact with a particular space.
Moreover, while analyzing geospatial data, you will get a clear picture of everything happening in that country or city.
It also lets you predict upcoming natural events or possible sales based on the relationship with the people and places.
Another important aspect of geospatial data analysis is the ability to show and filter datasets that are impossible to understand without a visual representation.
In summary, with geospatial data analysis, you can determine not only what, where, and when an event happens but also get an idea of why that happened in a specific area or time.
When Should You Use Geospatial Data in Analytics?
Using geospatial data while analyzing traditional business data is beneficial for better decision-making. Besides, this data can be used in many industries and fields, such as transportation, urban planning, marketing, and environmental sustainability.
Suppose you have a large dataset that contains geographical data (latitude and longitude).
In that case, you should analyze the geospatial data for more accurate predictions, understand customer behavior and movement, and take necessary actions to boost your business.
Moreover, geospatial data is crucial for analyzing environmental sustainability, natural catastrophes (earthquakes, cyclones), and military developments.
While working with geospatial data, you can use the interactive display of geographic information to display real-world scenarios (on world maps) and answer queries that are impossible to understand by looking at the dataset.
To learn more about how geospatial data analytics is improving and contributing to several industries, move down to the next section.
Benefits of Analyzing Geospatial Data
All types of organizations can benefit from using geospatial data analytics. There are several scenarios where you will need location-based data to understand what’s really going on.
For instance, geospatial data analysis gives advance warnings about upcoming events, a deeper understanding of the data, and elevated efficiency.
The following are the benefits of analyzing geospatial data:
Identify Patterns and Trends
Finding patterns and trends is quite impossible when dealing with a gigantic dataset. Fortunately, geospatial data analysis allows us to see relationships and connections between two values to understand the patterns and trends in the data.
Filter Data Based on Geography
Some data visualizations are incomplete unless you can filter them based on places. If your dataset contains the latitude and longitude of places, geospatial analysis can easily filter the data based on that location and help to get more details from an analysis.
Model the Real World
Whether you’re analyzing your business sales or developing a new product for new users, you need to consider the location, as it is a crucial component of the analysis.
Using the geospatial data, you can effortlessly model the real world and get into details that are impossible to gather without geospatial analytics.
Get Accurate Predictions
While observing an event of a particular location, it’s hard to understand the data relationships and predicate any possible future event. However, geospatial analytics makes it easier to understand why a phenomenon happens, along with where and when it happens.
Because of these statistics, we can better understand and predict future events and take necessary precautions to eliminate the negative impacts on that particular location.
Develop New Products and Solutions
Large organizations or manufacturers can build new products and solutions based on location by analyzing geospatial data.
For instance, if an organization is developing a kit for people with visual impairments, they might consider areas like California, Texas, and Florida because these States have more visual impairments than others.
It’s hard to get the details of people with visual impairments (especially locations) unless you analyze geospatial data.
Types of Geospatial Data
Primarily, there are two types of geospatial data: Vector and Raster data. Moreover, you will find another type of geospatial data known as Attributes.
Not each type of data can be visualized with all programs, meaning one data type may go best with one tool, whereas the other best suits another.
However, all types of geospatial data must contain coordinate reference system (CRS) information. This information is essential to visualize the data based on the location.
Here are the different types of geospatial data:
Vector Data
Vector data can determine the exact location on Earth using points, lines, and polygons. Each of these parameters has different usages. To learn more, consider the subsequent discussion.
The vector data points are used to describe notable landmarks and structures. Vector data lines are used to describe a series of points such as rivers, roads, or expressways.
Finally, the vector data polygons are used to describe more complicated shapes, such as a country’s border.
Raster Data
Raster data is another form of geospatial data that stores values as a grid of regular-sized pixels. This grid-based data contains geographic location characteristics. Each pixel referred to a specific location on Earth.
Raster data is comparable with digital images. For instance, digital images are zillions of individual pixels, each pixel having its own value.
Similarly, each pixel of raster data has actual coordinates information to show live locations on the world map.
Attributes
Attribute data is non-spatial data used to identify and describe spatial objects. Attributes are not directly connected to geospatial data, but they can enrich the dataset by providing descriptive data along with your geospatial data.
Now that we have a clear idea of each type of geospatial data, let’s discuss how businesses and industries utilize this data to change world scenarios.
How to Use Geospatial Data Analysis Effectively
More and more industries and businesses are now opting for geospatial data to analyze user’s behavior and usage patterns. Multiple sectors are leveraging the power of geospatial data analysis effectively to get some extra information that isn’t possible with regular datasets.
The following industries are utilizing geospatial data analysis for increasing outcomes:
Risk Assessment
Organizations can determine possible and upcoming natural disasters by analyzing the geospatial data of a particular place.
It helps them to understand the vulnerability and reduce the impact of catastrophes.
For instance, a developer company can observe the geospatial data and decide where to build the next skyscraper.
Visit Attribution
By analyzing the geospatial data (combining mobility and property data); store owners can quickly identify who visits the store and how frequently they visit it.
Competitive Intelligence
Business owners can determine which aspects and business points are impacting their store by inspecting the geospatial data near the business.
It also lets the owners know about people’s positive and negative interests based on the store’s location. As a result, the owners can take the required actions to save the store from upcoming incidents and even increase overall sales.
Investment Research
With a clear insight into geospatial data, it’s easier to follow consumer’s movement and behavior patterns. Investment farms can use geo-based data to study recent investments’ positive and negative outcomes.
As a result, they can choose what businesses are worth investing multiple millions of dollars in, which helps to reduce the consequences and make a humongous profit.
Consumer Insights
Before opening a new outlet or chain store, you must understand that specific area’s sales pattern and consumer insights.
Geospatial data analysis lets you dive deep into consumer behaviors and their purchasing patterns, which is crucial to success in store business.
Limitations of Analyzing Geospatial Data
However, some limitations determine how much information you can analyze at once.
ArcGIS Power BI Limitations
Remember, there are several limitations on both ArcGIS and Power BI. To learn about the limitations, consider the following table.
| Parameters | Limitations |
|---|---|
| Address Points | 3,500 address points for regular users and 10,000 points for ArcGIS account users. |
| Data Points | The default Power BI data points limit is 1,000, and it can get up to 30,000 depending on the account. |
| Locations per Map | 3,500 locations per map for regular users and 10,000 for ArcGIS account users. |
| Points on the Map | The map can contain 30,000 points. |
| Data Capacity | 1 GB data capacity for free users and 10 GB for Power BI Pro users. |
How to Analyze Geospatial Data with Power BI
When you have a geospatial dataset, you can add the dataset to the Power BI Desktop application and use the ArcGIS Maps for Power BI to analyze the geospatial data.
Here are the steps to load and analyze the geospatial data in Power BI:
1. Gather Your Geospatial Data
While performing geospatial analysis in Power BI, Bing Maps controls the analytics. Let’s start the procedure by gathering geospatial test data.
I will use a data set containing world countries, cities, and populations in this guide. You can download a similar CSV file from the Web and modify the columns according to your needs.
Also, ensure you have installed the latest version of the Power BI Desktop application on your machine. You can load the data to the program once the geospatial test data and the Power BI app are ready.
2. Load the Data to Power BI
To load the geospatial data to Power BI, execute the subsequent instructions.
- Launch the Power BI Desktop application.
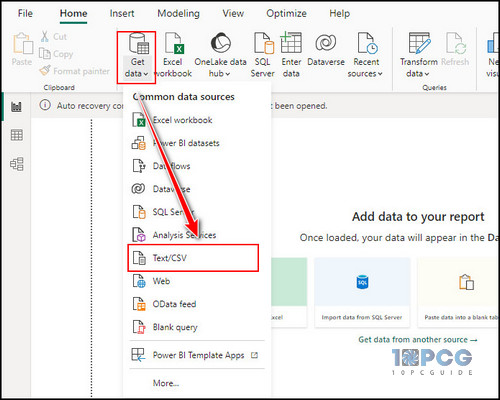
- Click on the Get Data menu under the Home tab.
- Choose Select/CSV from the dropdown menu.
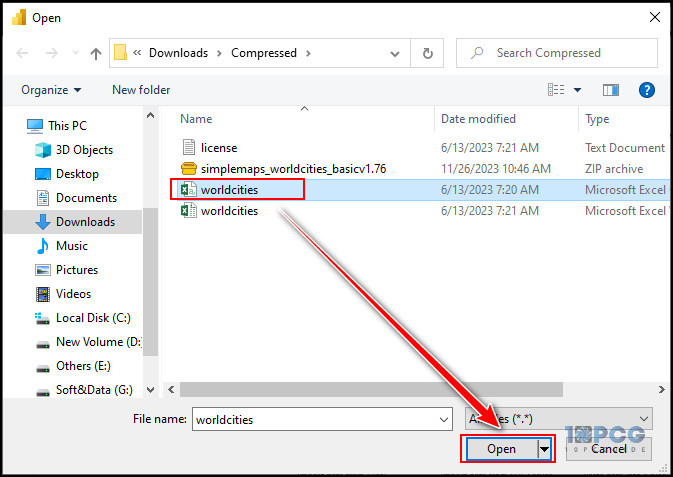
- Select the CSV file stored on your computer and click Open.
- Click Load from the popup window.
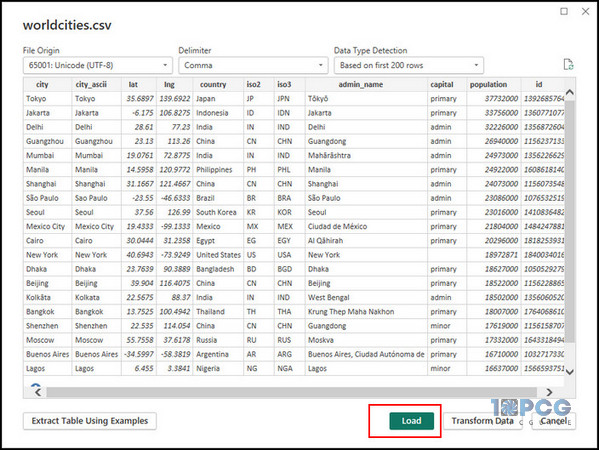
After loading the data, you will see a new dataset under the fields pane. Once the dataset is loaded, you can visualize the data using the ArcGIS Maps for Power BI.
3. Use ArcGIS to Visualize the Data
From the Visualization section, click on ArcGIS Maps for Power BI and adjust the map window layout to fit in the report window.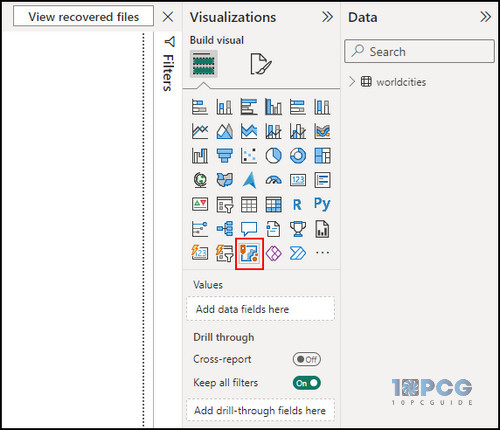
Now expand the dataset (worldcities) from the DATA tab and check the County data. It will immediately be added to the map, and a field will be added to the Location section. Power BI will now look like the following image.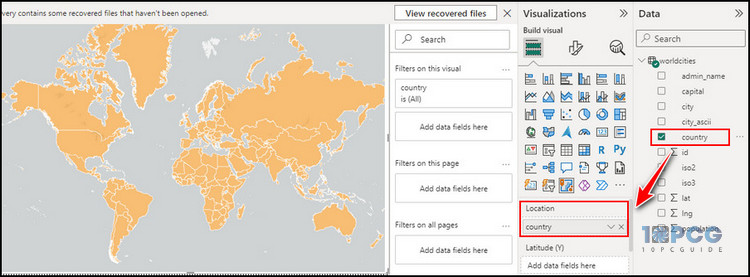
Now, let’s consider that we need to visualize the map based on the population.
To do so, check the population data from the DATA tab. It will instantly add the population data to the map, and you will notice the changes on the map.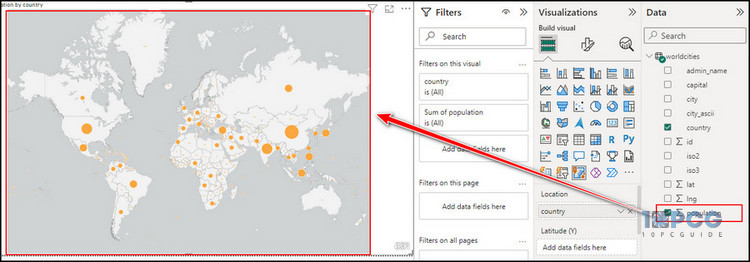
If you click on the map data, it will show you the country name and the sum of populations.
You can repeat the process for all countries, and Power BI will show you the total population of the selected countries and cities. Use the Filter option for customized visualization.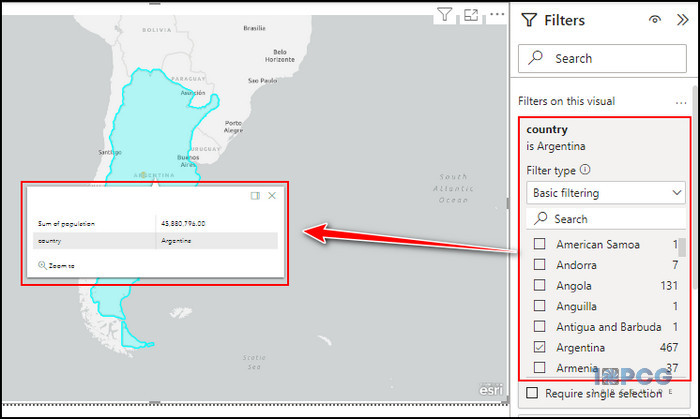
Wrap Up
While working with geospatial data, the best way to get a satisfying output is to visualize the data with ArcGIS maps for Power BI. Besides, Power BI allows users to customize and visualize the data in real-time using Bing Maps.
Throughout this article, I have covered all the relevant topics that come along the path while performing geospatial data analysis.
However, if you’ve further queries regarding geospatial data analysis, let me know in the comment below.