When cross-highlighting fails to function, the interconnected visualizations lose their ability to dynamically point out relevant data across different charts or graphs. It stops you from gaining comprehensive insights.
Also, as the seamless coordination between visuals is disrupted, Power BI loses its capacity to deliver meaningful and interconnected data visualizations.
That’s why, in this article, I’ll provide the methods to restore the cross-highlighting functionality.
Let’s begin!
How to Fix Cross Highlight Not Working in Power BI
When highlighting data in Power BI, visuals won’t work as expected if you do not establish the relationships correctly. Check that the fields used for cross-highlighting have appropriate relationships and are properly related.
Also, verify that cross-highlighting is enabled for the visualizations you’re working with, and update the software to the latest version for bug fixes and improvements.
If the issue persists, check out the methods below, where I’ve described how to troubleshoot the cross-highlighting not functioning issue.
Here are the methods to fix cross-highlight not working in Power BI:
1. Enable Cross Highlighting/Filtering by Default
If you haven’t turned on the cross-highlighting/filtering option from the Power BI settings, the Edit Interactions feature won’t work. That means when you select data points in one visual, the corresponding data points in other visuals are not highlighted.
So, allow cross-highlighting and check if it works as expected.
Here are the steps to enable cross-highlighting/filtering by default:
- Open the report that does not highlight your visuals in Power BI.
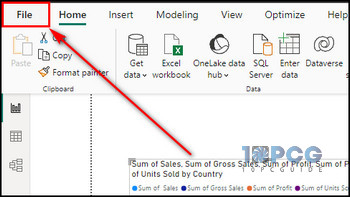
- Choose the File option from the upper left.
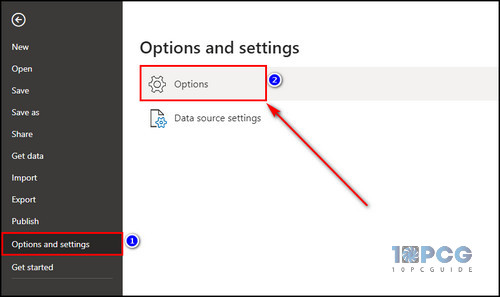
- Select the Options and settings tab from the left bar and click on Options.
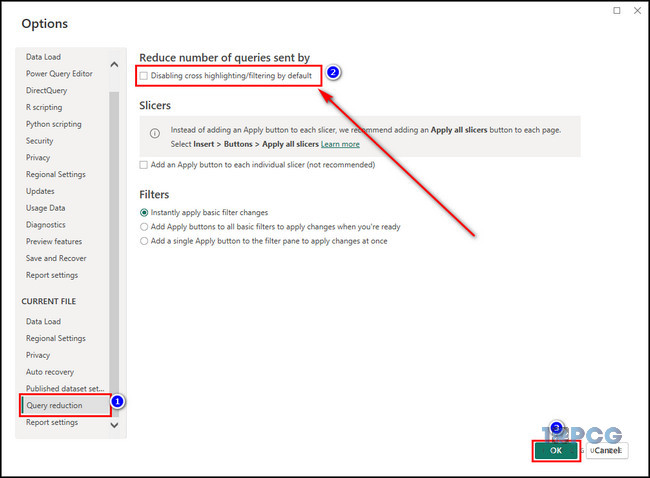
- Scroll down and choose Query reduction under the Current File section.
- Make sure the Disabling cross highlighting/filtering by default option is unchecked, and click OK.
2. Turn Off Default Cross Filtering
Now that you have enabled both cross-highlighting and filtering, you need to turn off the filtering feature. That way, only the highlighting option is turned on by default, and the filtering feature doesn’t cause any dispute with your visuals.
Here’s the process to turn off cross-filtering by default:
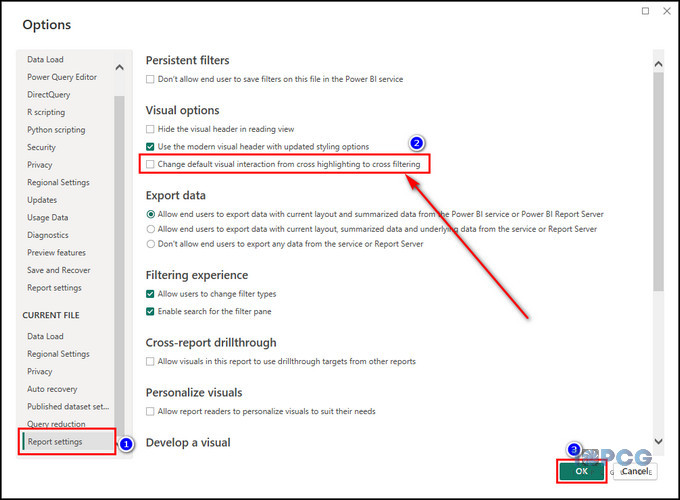
- Launch Power BI and select File > Options and settings > Options.
- Go to the Report settings tab.
- Uncheck the Change default visual interaction from cross highlighting to cross filtering.
- Click OK to apply the changes.
3. Ensure Cross-Highlight Supports the Visual Type
While pie charts and bar charts allow you to emphasize and focus on particular data points or categories in your report visualization, the highlight function has limits.
You should know with certain visual types, cross-highlight does not work. When you select those types, the Highlight option doesn’t show up when editing interactions.
In the table below, I’ve categorized all the visual types, explaining whether they support cross-highlighting:
| Cross-Highlight Supported Visual Types | Cross-Highlight Not Supported Visual Types |
|---|---|
| ● Stacked bar chart ● Stacked column chart ● Clustered bar chart ● 100% Stacked bar chart ● Line and stacked column chart ● Line and clustered column chart ● Ribbon chart ● Funnel ● Pie chart ● Donut chart ● Treemap ● Decomposition tree ● Q&A | ● Line chart ● Area chart ● Stacked area chart ● Waterfall chart ● Scatter chart ● Map ● Filled map ● Azure map ● Gauge ● Card ● Multi-row card ● KPI ● Slicer ● Table ● Matrix ● R script visual ● Python visual ● Key influencers ● Smart narrative ● Matrics (Preview) ● Paginated report ● ArcGIS Maps for Power BI ● Power Apps for Power BI ● Power Automate for Power BI |
4. Make sure the Data Matches for All Visuals
Ensure that the fields used for cross-highlighting are the same in both visuals. If there’s a mismatch, Power BI won’t be able to establish the connection, and the highlighting feature won’t function.
Check whether the fields in your report have common values across all the visuals.
For example, if you are using a category like Product, verify that it is present in all the visual types and that the data matches.
5. Check the Data Types
Make sure that the data types of the fields used for cross-highlighting are consistent. Otherwise, visuals in Power BI do not interact properly with graphs.
For instance, if one visual is using a Date field and the other is using a Text field, cross-highlighting doesn’t operate.
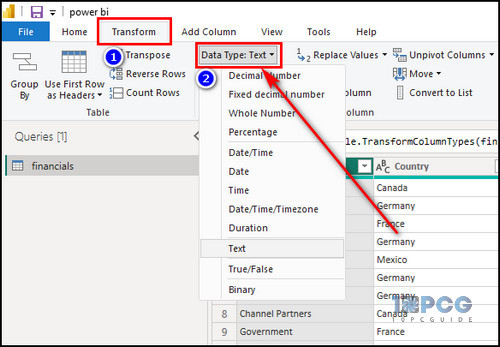
Follow the steps below to check the data types:
- Open your Power BI report.
- Click the Transform data button from the toolbar.

- Go to the Transform tab.
- Select a field and check its Data Type from the Any Column section.
6. Make Sure All Relationships are Assigned Correctly
Relationships between tables in Power BI are fundamental for accurate data representation.
So, verify that you’ve correctly defined all relationships and that cardinality, such as one-to-one or one-to-many relationships, is appropriate for the data model in order to resolve cross-highlighting related issues.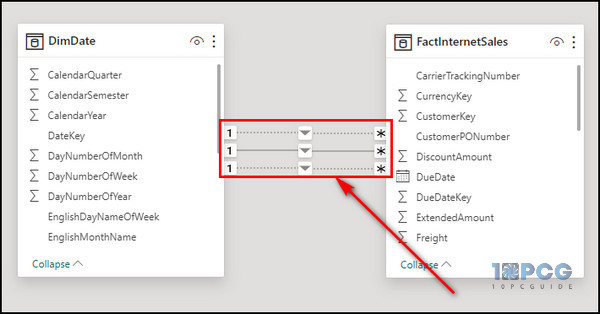
Final Thoughts
As you can see, by ensuring proper relationships, examining data types, and utilizing appropriate visualization techniques, you can easily overcome cross-highlight issues. So, have a more insightful and seamless data analysis experience in Power BI.
Comment below if you have further questions, and we’ll get back to you.